LinkedIn 2011 Annual Report Download - page 49
Download and view the complete annual report
Please find page 49 of the 2011 LinkedIn annual report below. You can navigate through the pages in the report by either clicking on the pages listed below, or by using the keyword search tool below to find specific information within the annual report.-
 1
1 -
2
-
3
-
4
-
5
-
6
-
7
-
8
-
9
-
10
-
11
-
12
-
13
-
14
-
15
-
16
-
17
-
18
-
19
-
20
-
21
-
22
-
23
-
24
-
25
-
26
-
27
-
28
-
29
-
30
-
31
-
32
-
33
-
34
-
35
-
36
-
37
-
38
-
 39
39 -
 40
40 -
 41
41 -
 42
42 -
 43
43 -
 44
44 -
 45
45 -
 46
46 -
 47
47 -
 48
48 -
 49
49 -
 50
50 -
 51
51 -
 52
52 -
 53
53 -
 54
54 -
 55
55 -
 56
56 -
 57
57 -
 58
58 -
 59
59 -
60
-
61
-
62
-
63
-
64
-
65
-
66
-
67
-
68
-
69
-
70
-
71
-
72
-
73
-
74
-
75
-
76
-
77
-
78
-
79
-
80
-
81
-
82
-
83
-
84
-
85
-
86
-
87
-
88
-
89
-
90
-
91
-
92
-
93
-
94
-
95
-
96
-
97
-
98
-
99
-
100
-
101
-
102
-
103
-
104
-
105
-
106
-
107
-
108
-
109
-
110
-
111
-
112
 |
 |

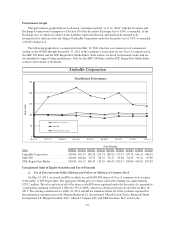
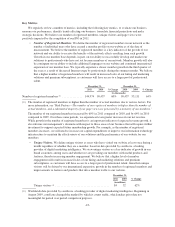
The number of LinkedIn Corporate Solutions customers increased by 139% in 2011 compared to 2010, and
by 144% in 2010 compared to 2009. During these periods, we experienced an increase in net revenue from
sales of our hiring solutions, both in terms of absolute net revenue and as a percentage of our total net
revenue (as further described in “Results of Operations” below), which was, and continues to be, largely
driven by increases in the number of our customers that have purchased our LinkedIn Corporation Solutions
products.
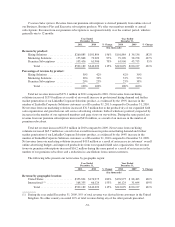
•Sales Channel Mix. Depending on the specific product, we sell our hiring and marketing solutions
offline through our field sales organization or online on our website. The vast majority of our premium
subscriptions are sold online on our website. Our field sales organization uses a direct sales force to
solicit customers, agencies and resellers. This offline channel is characterized by a longer sales cycle
where price can be negotiated, higher relative average selling prices, longer contract terms, higher
selling expenses and a longer cash collection cycle compared to our online channel.
Our online sales channel allows members to purchase solutions directly on our website. Members can
purchase premium subscriptions as well as certain lower priced products in our hiring and marketing
solutions, such as job postings and self-service advertising. This channel is characterized by lower average
selling prices and higher cancellations compared to our offline channel, lower selling costs due to our
automated payments platform and a highly liquid collection cycle.
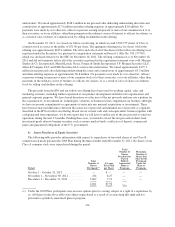
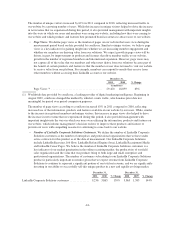
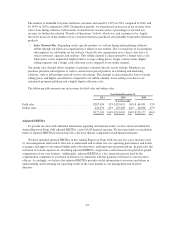
The following table presents our net revenue by field sales and online sales:
Year Ended December 31,
2011 2010 2009
($ in thousands)
Field sales ....................................... $287,634 55% $135,691 56% $ 64,031 53%
Online sales ..................................... 234,555 45% 107,408 44% 56,096 47%
$522,189 100% $243,099 100% $120,127 100%
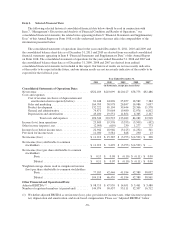
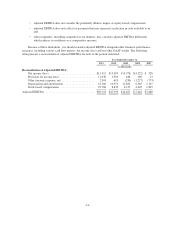
Adjusted EBITDA
To provide investors with additional information regarding our financial results, we have disclosed within this
Annual Report on Form 10-K adjusted EBITDA, a non-GAAP financial measure. We have provided a reconciliation
below of adjusted EBITDA to net income (loss), the most directly comparable GAAP financial measure.
We have included adjusted EBITDA in this Annual Report on Form 10-K because it is a key measure used
by our management and board of directors to understand and evaluate our core operating performance and trends,
to prepare and approve our annual budget and to develop short- and long-term operational plans. In particular, the
exclusion of certain expenses in calculating adjusted EBITDA can provide a useful measure for period-to-period
comparisons of our core business. Additionally, adjusted EBITDA is a key financial measure used by the
compensation committee of our board of directors in connection with the payment of bonuses to our executive
officers. Accordingly, we believe that adjusted EBITDA provides useful information to investors and others in
understanding and evaluating our operating results in the same manner as our management and board of
directors.
-45-