LinkedIn 2011 Annual Report Download - page 62
Download and view the complete annual report
Please find page 62 of the 2011 LinkedIn annual report below. You can navigate through the pages in the report by either clicking on the pages listed below, or by using the keyword search tool below to find specific information within the annual report.-
 1
1 -
2
-
3
-
4
-
5
-
6
-
7
-
8
-
9
-
10
-
11
-
12
-
13
-
14
-
15
-
16
-
17
-
18
-
19
-
20
-
21
-
22
-
23
-
24
-
25
-
26
-
27
-
28
-
29
-
30
-
31
-
32
-
33
-
34
-
35
-
36
-
37
-
38
-
39
-
40
-
41
-
42
-
43
-
44
-
45
-
46
-
47
-
48
-
49
-
50
-
51
-
 52
52 -
 53
53 -
 54
54 -
 55
55 -
 56
56 -
 57
57 -
 58
58 -
 59
59 -
 60
60 -
 61
61 -
 62
62 -
 63
63 -
 64
64 -
 65
65 -
 66
66 -
 67
67 -
 68
68 -
 69
69 -
 70
70 -
 71
71 -
 72
72 -
73
-
74
-
75
-
76
-
77
-
78
-
79
-
80
-
81
-
82
-
83
-
84
-
85
-
86
-
87
-
88
-
89
-
90
-
91
-
92
-
93
-
94
-
95
-
96
-
97
-
98
-
99
-
100
-
101
-
102
-
103
-
104
-
105
-
106
-
107
-
108
-
109
-
110
-
111
-
112
 |
 |

For the Three Months Ended
Dec 31,
2011
Sep 30,
2011
Jun 30,
2011
Mar 31,
2011
Dec 31,
2010
Sep 30,
2010
Jun 30,
2010
Mar 31,
2010
(as a percentage of revenue)
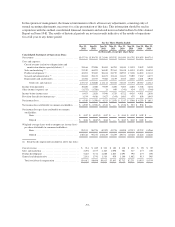
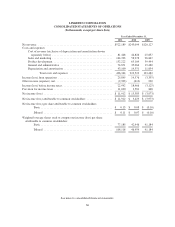
Consolidated Statements of Operations Data: (1)
Net revenue ........................................ 100% 100% 100% 100% 100% 100% 100% 100%
Costs and expenses:
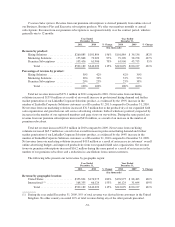
Costofrevenue ................................. 14 16 15 18 18 19 18 19
Sales and marketing . . . . . . . . . . . . . . . . . . . . . . . . . . . . . 32 33 30 31 25 24 24 23
Product development . . . . . . . . . . . . . . . . . . . . . . . . . . . . . 25 25 25 26 26 28 27 27
General and administrative . . . . . . . . . . . . . . . . . . . . . . . . 15 14 14 14 14 15 14 15
Depreciation and amortization ..................... 8 8 8 9 8 8 8 9
Total costs and expenses . . . . . . . . . . . . . . . . . . . . . . 94 97 92 99 91 94 90 93
Income from operations . . . . . . . . . . . . . . . . . . . . . . . . . . . . . . 6 3 8 1 9 6 10 7
Other income (expense), net . . . . . . . . . . . . . . . . . . . . . . . . . . . (1) (1) 0 0 (0) 1 (1) (1)
Income before income taxes ........................... 5 2 8 2 8 7 9 6
Provision (benefit) for income taxes . . . . . . . . . . . . . . . . . . . . . 1 3 4 (0) 2 1 1 2
Net income (loss) . . . . . . . . . . . . . . . . . . . . . . . . . . . . . . . . . . . 4% (1)% 4% 2% 7% 6% 8% 4%
(1) Certain items may not total due to rounding.
For the Three Months Ended
Dec 31,
2011
Sep 30,
2011
Jun 30,
2011
Mar 31,
2011
Dec 31,
2010
Sep 30,
2010
Jun 30,
2010
Mar 31,
2010
(in thousands)
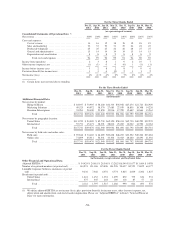
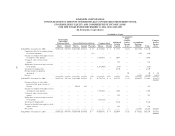
Additional Financial Data:
Net revenue by product:
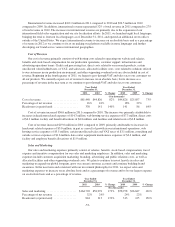
Hiring Solutions ....................... $ 84,937 $ 70,995 $ 58,620 $46,333 $35,958 $27,274 $21,723 $16,929
Marketing Solutions .................... 49,523 40,072 38,570 27,683 27,939 18,836 18,308 14,226
Premium Subscriptions .................. 33,281 28,409 23,850 19,916 17,799 15,682 14,864 13,561
Total ............................ $167,741 $139,476 $121,040 $93,932 $81,696 $61,792 $54,895 $44,716
Net revenue by geographic location:
United States .......................... $111,970 $ 94,005 $ 82,739 $65,120 $58,411 $45,730 $40,299 $32,535
International .......................... 55,771 45,471 38,301 28,812 23,285 16,062 14,596 12,181
Total ............................ $167,741 $139,476 $121,040 $93,932 $81,696 $61,792 $54,895 $44,716
Net revenue by field sales and online sales:
Field sales ............................ $ 95,842 $ 74,465 $ 66,699 $50,628 $48,253 $33,552 $30,202 $23,684
Online sales ........................... 71,899 65,011 54,341 43,304 33,443 28,240 24,693 21,032
Total ............................ $167,741 $139,476 $121,040 $93,932 $81,696 $61,792 $54,895 $44,716
For the Three Months Ended
Dec 31,
2011
Sep 30,
2011
Jun 30,
2011
Mar 31,
2011
Dec 31,
2010
Sep 30,
2010
Jun 30,
2010
Mar 31,
2010
(in thousands, except customer and headcount data)
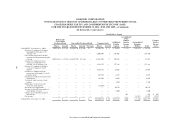
Other Financial and Operational Data:
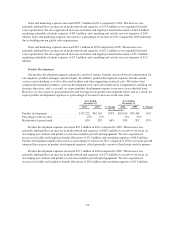
Adjusted EBITDA (1) ............................$ 34,424 $ 24,661 $ 26,346 $ 13,282 $16,340 $11,077 $11,464 $ 9,078
Number of registered members (at period end) ........ 144,974 131,186 115,808 101,528 90,437 80,553 71,825 64,177
LinkedIn Corporate Solutions customers (at period
end) ........................................ 9,236 7,366 6,072 4,774 3,865 2,849 2,306 1,827
Headcount (at period end): ........................
United States .............................. 1,641 1,452 1,251 1,099 872 775 636 531
International . . . . . . . . . . . . . . . . . . . . . . . . . . . . . . . 475 345 264 189 118 87 57 41
Total ................................. 2,116 1,797 1,515 1,288 990 862 693 572
(1) We define adjusted EBITDA as net income (loss), plus: provision (benefit) for income taxes, other (income) expense, net,
depreciation and amortization, and stock-based compensation. Please see “Adjusted EBITDA” in Item 6 “Selected Financial
Data” for more information.
-58-