LinkedIn 2011 Annual Report Download - page 43
Download and view the complete annual report
Please find page 43 of the 2011 LinkedIn annual report below. You can navigate through the pages in the report by either clicking on the pages listed below, or by using the keyword search tool below to find specific information within the annual report.-
 1
1 -
2
-
3
-
4
-
5
-
6
-
7
-
8
-
9
-
10
-
11
-
12
-
13
-
14
-
15
-
16
-
17
-
18
-
19
-
20
-
21
-
22
-
23
-
24
-
25
-
26
-
27
-
28
-
29
-
30
-
31
-
32
-
 33
33 -
 34
34 -
 35
35 -
 36
36 -
 37
37 -
 38
38 -
 39
39 -
 40
40 -
 41
41 -
 42
42 -
 43
43 -
 44
44 -
 45
45 -
 46
46 -
 47
47 -
 48
48 -
 49
49 -
 50
50 -
 51
51 -
 52
52 -
 53
53 -
54
-
55
-
56
-
57
-
58
-
59
-
60
-
61
-
62
-
63
-
64
-
65
-
66
-
67
-
68
-
69
-
70
-
71
-
72
-
73
-
74
-
75
-
76
-
77
-
78
-
79
-
80
-
81
-
82
-
83
-
84
-
85
-
86
-
87
-
88
-
89
-
90
-
91
-
92
-
93
-
94
-
95
-
96
-
97
-
98
-
99
-
100
-
101
-
102
-
103
-
104
-
105
-
106
-
107
-
108
-
109
-
110
-
111
-
112
 |
 |

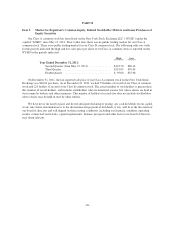
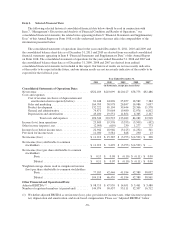
Item 6. Selected Financial Data
The following selected historical consolidated financial data below should be read in conjunction with
Item 7, “Management’s Discussion and Analysis of Financial Condition and Results of Operations,” our
consolidated financial statements, the related notes appearing in Item 8 “Financial Statements and Supplementary
Data” of this Annual Report on Form 10-K to fully understand factors that may affect the comparability of the
information presented below.
The consolidated statements of operations data for the years ended December 31, 2011, 2010 and 2009 and
the consolidated balance sheet data as of December 31, 2011 and 2010 are derived from our audited consolidated
financial statements appearing in Item 8 “Financial Statements and Supplementary Data” of this Annual Report
on Form 10-K. The consolidated statements of operations for the years ended December 31, 2008 and 2007 and
the consolidated balance sheet data as of December 31, 2009, 2008 and 2007 are derived from audited
consolidated financial statements not included in this report. Our historical results are not necessarily indicative
of the results to be expected in the future, and our interim results are not necessarily indicative of the results to be
expected for the full fiscal year.
Year Ended December 31,
2011 2010 2009 2008 2007
(in thousands, except per share data)
Consolidated Statements of Operations Data:
Net revenue ................................... $522,189 $243,099 $120,127 $78,773 $32,486
Costs and expenses:
Cost of revenue (exclusive of depreciation and
amortization shown separately below) ......... 81,448 44,826 25,857 18,589 7,384
Sales and marketing ......................... 164,703 58,978 26,847 16,986 5,037
Product development ........................ 132,222 65,104 39,444 29,366 11,578
General and administrative ................... 74,871 35,064 19,480 12,976 6,812
Depreciation and amortization ................. 43,100 19,551 11,854 6,365 2,107
Total costs and expenses ............. 496,344 223,523 123,482 84,282 32,918
Income (loss) from operations ..................... 25,845 19,576 (3,355) (5,509) (432)
Other income (expense), net ....................... (2,903) (610) 230 1,277 773
Income (loss) before income taxes .................. 22,942 18,966 (3,125) (4,232) 341
Provision for income taxes ........................ 11,030 3,581 848 290 13
Net income (loss) ............................... $ 11,912 $ 15,385 $ (3,973) $ (4,522) $ 328
Net income (loss) attributable to common
stockholders ................................. $ 11,912 $ 3,429 $ (3,973) $ (4,522) $ —
Net income (loss) per share attributable to common
stockholders:
Basic ................................. $ 0.15 $ 0.08 $ (0.10) $ (0.11) $ 0.00
Diluted ............................... $ 0.11 $ 0.07 $ (0.10) $ (0.11) $ 0.00
Weighted-average shares used to compute net income
(loss) per share attributable to common stockholders:
Basic ................................. 77,185 42,446 41,184 42,389 38,092
Diluted ............................... 104,118 46,459 41,184 42,389 38,961
Other Financial and Operational Data:
Adjusted EBITDA (1) ............................ $ 98,713 $ 47,959 $ 14,651 $ 5,461 $ 3,480
Number of registered members (at period end) ........ 144,974 90,437 55,111 32,307 16,712
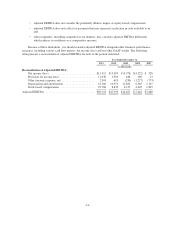
(1) We define adjusted EBITDA as net income (loss), plus: provision for income taxes, other (income) expense,
net, depreciation and amortization, and stock-based compensation. Please see “Adjusted EBITDA” below
-39-