LinkedIn 2011 Annual Report Download - page 70
Download and view the complete annual report
Please find page 70 of the 2011 LinkedIn annual report below. You can navigate through the pages in the report by either clicking on the pages listed below, or by using the keyword search tool below to find specific information within the annual report.-
 1
1 -
2
-
3
-
4
-
5
-
6
-
7
-
8
-
9
-
10
-
11
-
12
-
13
-
14
-
15
-
16
-
17
-
18
-
19
-
20
-
21
-
22
-
23
-
24
-
25
-
26
-
27
-
28
-
29
-
30
-
31
-
32
-
33
-
34
-
35
-
36
-
37
-
38
-
39
-
40
-
41
-
42
-
43
-
44
-
45
-
46
-
47
-
48
-
49
-
50
-
51
-
52
-
53
-
54
-
55
-
56
-
57
-
58
-
59
-
 60
60 -
 61
61 -
 62
62 -
 63
63 -
 64
64 -
 65
65 -
 66
66 -
 67
67 -
 68
68 -
 69
69 -
 70
70 -
 71
71 -
 72
72 -
 73
73 -
 74
74 -
 75
75 -
 76
76 -
 77
77 -
 78
78 -
 79
79 -
 80
80 -
81
-
82
-
83
-
84
-
85
-
86
-
87
-
88
-
89
-
90
-
91
-
92
-
93
-
94
-
95
-
96
-
97
-
98
-
99
-
100
-
101
-
102
-
103
-
104
-
105
-
106
-
107
-
108
-
109
-
110
-
111
-
112
 |
 |

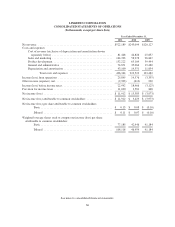
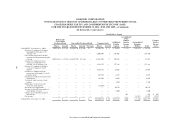
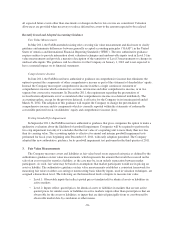
LINKEDIN CORPORATION
CONSOLIDATED STATEMENTS OF OPERATIONS
(In thousands, except per share data)
Year Ended December 31,
2011 2010 2009
Net revenue .................................................... $522,189 $243,099 $120,127
Costs and expenses:
Cost of revenue (exclusive of depreciation and amortization shown
separately below) .......................................... 81,448 44,826 25,857
Sales and marketing .......................................... 164,703 58,978 26,847
Product development ......................................... 132,222 65,104 39,444
General and administrative .................................... 74,871 35,064 19,480
Depreciation and amortization .................................. 43,100 19,551 11,854
Total costs and expenses .............................. 496,344 223,523 123,482
Income (loss) from operations ...................................... 25,845 19,576 (3,355)
Other income (expense), net ........................................ (2,903) (610) 230
Income (loss) before income taxes ................................... 22,942 18,966 (3,125)
Provision for income taxes ......................................... 11,030 3,581 848
Net income (loss) ................................................ $ 11,912 $ 15,385 $ (3,973)
Net income (loss) attributable to common stockholders .................. $ 11,912 $ 3,429 $ (3,973)
Net income (loss) per share attributable to common stockholders:
Basic .................................................. $ 0.15 $ 0.08 $ (0.10)
Diluted ................................................ $ 0.11 $ 0.07 $ (0.10)
Weighted-average shares used to compute net income (loss) per share
attributable to common stockholders:
Basic .................................................. 77,185 42,446 41,184
Diluted ................................................ 104,118 46,459 41,184
See notes to consolidated financial statements.
66