LinkedIn 2011 Annual Report Download - page 44
Download and view the complete annual report
Please find page 44 of the 2011 LinkedIn annual report below. You can navigate through the pages in the report by either clicking on the pages listed below, or by using the keyword search tool below to find specific information within the annual report.-
 1
1 -
2
-
3
-
4
-
5
-
6
-
7
-
8
-
9
-
10
-
11
-
12
-
13
-
14
-
15
-
16
-
17
-
18
-
19
-
20
-
21
-
22
-
23
-
24
-
25
-
26
-
27
-
28
-
29
-
30
-
31
-
32
-
33
-
 34
34 -
 35
35 -
 36
36 -
 37
37 -
 38
38 -
 39
39 -
 40
40 -
 41
41 -
 42
42 -
 43
43 -
 44
44 -
 45
45 -
 46
46 -
 47
47 -
 48
48 -
 49
49 -
 50
50 -
 51
51 -
 52
52 -
 53
53 -
 54
54 -
55
-
56
-
57
-
58
-
59
-
60
-
61
-
62
-
63
-
64
-
65
-
66
-
67
-
68
-
69
-
70
-
71
-
72
-
73
-
74
-
75
-
76
-
77
-
78
-
79
-
80
-
81
-
82
-
83
-
84
-
85
-
86
-
87
-
88
-
89
-
90
-
91
-
92
-
93
-
94
-
95
-
96
-
97
-
98
-
99
-
100
-
101
-
102
-
103
-
104
-
105
-
106
-
107
-
108
-
109
-
110
-
111
-
112
 |
 |

for more information and for a reconciliation of adjusted EBITDA to net income (loss), the most directly
comparable financial measure calculated and presented in accordance with U.S. generally accepted
accounting principles, or GAAP.
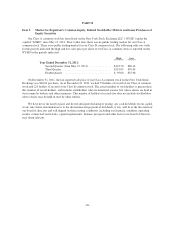
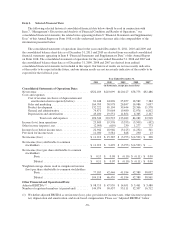
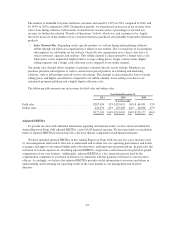
Stock-based compensation included in the statements of operations data above was as follows:
Year Ended December 31,
2011 2010 2009 2008 2007
(in thousands)
Cost of revenue ........................................ $ 1,678 $ 439 $ 370 $ 298 $ 87
Sales and marketing .................................... 8,074 1,225 657 513 163
Product development ................................... 13,625 3,248 2,346 1,214 599
General and administrative .............................. 6,391 3,920 2,779 2,580 956
Total stock-based compensation ...................... $29,768 $8,832 $6,152 $4,605 $1,805
As of December 31,
2011 2010 2009 2008 2007
(in thousands)
Consolidated Balance Sheet Data:
Cash and cash equivalents ....................... $339,048 $ 92,951 $ 89,979 $ 80,495 $17,946
Short-term investments ......................... 238,456 — — — —
Property and equipment, net ...................... 114,850 56,743 25,730 21,724 9,702
Working capital ............................... 499,268 66,734 71,885 71,486 10,175
Total assets ................................... 873,697 238,188 148,559 122,062 35,162
Redeemable convertible preferred stock ............ — 87,981 87,981 87,981 12,700
Convertible preferred stock ...................... — 15,846 15,413 15,413 15,413
Total stockholders’ equity ....................... 624,979 36,249 9,082 5,230 6,589
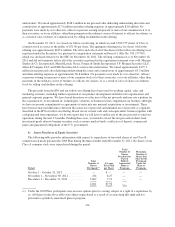
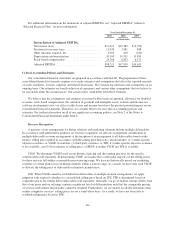
Adjusted EBITDA
To provide investors with additional information regarding our financial results, we have disclosed in the
table below and within this Annual Report on Form 10-K adjusted EBITDA, a non-GAAP financial measure. We
have provided a reconciliation below of adjusted EBITDA to net income (loss), the most directly comparable
GAAP financial measure.
We have included adjusted EBITDA in this Annual Report on Form 10-K because it is a key measure used
by our management and board of directors to understand and evaluate our core operating performance and trends,
to prepare and approve our annual budget and to develop short- and long-term operational plans. In particular, the
exclusion of certain expenses in calculating adjusted EBITDA can provide a useful measure for period-to-period
comparisons of our core business. Additionally, adjusted EBITDA is a key financial measure used by the
compensation committee of our board of directors in connection with the payment of bonuses to our executive
officers. Accordingly, we believe that adjusted EBITDA provides useful information to investors and others in
understanding and evaluating our operating results in the same manner as our management and board of
directors.
Our use of adjusted EBITDA has limitations as an analytical tool, and you should not consider it in isolation
or as a substitute for analysis of our results as reported under GAAP. Some of these limitations are:
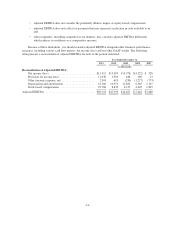
• although depreciation and amortization are non-cash charges, the assets being depreciated and
amortized may have to be replaced in the future, and adjusted EBITDA does not reflect cash capital
expenditure requirements for such replacements or for new capital expenditure requirements;
• adjusted EBITDA does not reflect changes in, or cash requirements for, our working capital needs;
-40-