LinkedIn 2011 Annual Report Download - page 63
Download and view the complete annual report
Please find page 63 of the 2011 LinkedIn annual report below. You can navigate through the pages in the report by either clicking on the pages listed below, or by using the keyword search tool below to find specific information within the annual report.-
 1
1 -
2
-
3
-
4
-
5
-
6
-
7
-
8
-
9
-
10
-
11
-
12
-
13
-
14
-
15
-
16
-
17
-
18
-
19
-
20
-
21
-
22
-
23
-
24
-
25
-
26
-
27
-
28
-
29
-
30
-
31
-
32
-
33
-
34
-
35
-
36
-
37
-
38
-
39
-
40
-
41
-
42
-
43
-
44
-
45
-
46
-
47
-
48
-
49
-
50
-
51
-
52
-
 53
53 -
 54
54 -
 55
55 -
 56
56 -
 57
57 -
 58
58 -
 59
59 -
 60
60 -
 61
61 -
 62
62 -
 63
63 -
 64
64 -
 65
65 -
 66
66 -
 67
67 -
 68
68 -
 69
69 -
 70
70 -
 71
71 -
 72
72 -
 73
73 -
74
-
75
-
76
-
77
-
78
-
79
-
80
-
81
-
82
-
83
-
84
-
85
-
86
-
87
-
88
-
89
-
90
-
91
-
92
-
93
-
94
-
95
-
96
-
97
-
98
-
99
-
100
-
101
-
102
-
103
-
104
-
105
-
106
-
107
-
108
-
109
-
110
-
111
-
112
 |
 |

For the Three Months Ended
Dec 31,
2011
Sep 30,
2011
Jun 30,
2011
Mar 31,
2011
Dec 31,
2010
Sep 30,
2010
Jun 30,
2010
Mar 31,
2010
(in thousands)
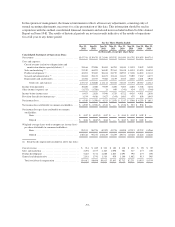
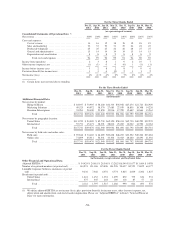
Reconciliation of adjusted EBITDA:
Net income (loss) ............................... $ 6,919 $ (1,598) $ 4,513 $ 2,078 $ 5,317 $ 3,960 $ 4,293 $1,815
Provision (benefit) for income taxes ................. 1,534 4,418 5,427 (349) 1,405 475 658 1,043
Other (income) expense, net ....................... 1,575 1,788 (11) (449) 341 (434) 357 346
Depreciation and amortization ..................... 13,784 11,555 9,602 8,159 6,565 4,845 4,201 3,940
Stock-based compensation ........................ 10,612 8,498 6,815 3,843 2,712 2,231 1,955 1,934
Adjusted EBITDA .............................. $34,424 $24,661 $26,346 $13,282 $16,340 $11,077 $11,464 $9,078
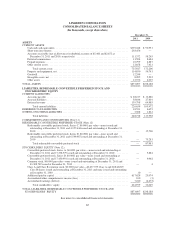
Liquidity and Capital Resources
Year Ended December 31,
2011 2010 2009
(in thousands)
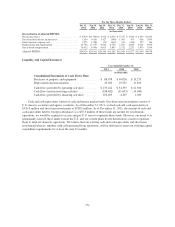
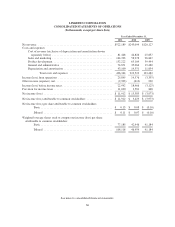
Consolidated Statements of Cash Flows Data:
Purchases of property and equipment ............. $ 88,978 $ 50,026 $ 13,279
Depreciation and amortization ................... 43,100 19,551 11,854
Cash flows provided by operating activities ........ $133,424 $ 54,353 $ 21,360
Cash flows used in investing activities ............ (338,482) (55,633) (13,044)
Cash flows provided by financing activities ........ 452,465 4,325 1,030
Cash and cash equivalents consist of cash and money market funds. Our short-term investments consist of
U.S. treasury securities and agency securities. As of December 31, 2011, we had cash and cash equivalents of
$339.0 million and short-term investments of $238.5 million. As of December 31, 2011, the amount of cash and
cash equivalents held by foreign subsidiaries was $53.3 million. If these funds are needed for our domestic
operations, we would be required to accrue and pay U.S. taxes to repatriate these funds. However, our intent is to
permanently reinvest these funds outside the U.S. and our current plans do not demonstrate a need to repatriate
them to fund our domestic operations. We believe that our existing cash and cash equivalents and short-term
investment balances, together with cash generated from operations, will be sufficient to meet our working capital
expenditure requirements for at least the next 12 months.
-59-