Konica Minolta 2008 Annual Report Download - page 57
Download and view the complete annual report
Please find page 57 of the 2008 Konica Minolta annual report below. You can navigate through the pages in the report by either clicking on the pages listed below, or by using the keyword search tool below to find specific information within the annual report.-
 1
1 -
2
-
3
-
4
-
5
-
6
-
7
-
8
-
9
-
10
-
11
-
12
-
13
-
14
-
15
-
16
-
17
-
18
-
19
-
20
-
21
-
22
-
23
-
24
-
25
-
26
-
27
-
28
-
29
-
30
-
31
-
32
-
33
-
34
-
35
-
36
-
37
-
38
-
39
-
40
-
41
-
42
-
43
-
44
-
45
-
46
-
 47
47 -
 48
48 -
 49
49 -
 50
50 -
 51
51 -
 52
52 -
 53
53 -
 54
54 -
 55
55 -
 56
56 -
 57
57 -
 58
58 -
 59
59 -
 60
60 -
 61
61 -
 62
62 -
 63
63
 |
 |

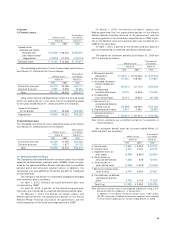
54
Thousands of U.S. dollars
North Asia Eliminations and
Japan America Europe and Other Total Corporate Consolidated
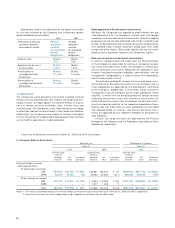
2008: Net sales
External $4,690,977 $2,333,906 $3,051,073 $ 619,383 $10,695,359 $ — $10,695,359
Intersegment 3,529,264 28,426 8,664 2,044,336 5,610,700 (5,610,700) —
Total 8,220,242 2,362,342 3,059,737 2,663,729 16,306,058 (5,610,700) 10,695,359
Operating expenses 7,013,684 2,351,143 2,955,175 2,614,433 14,934,445 (5,432,878) 9,501,567
Operating income $1,206,558 $ 11,199 $ 104,561 $ 49,286 $ 1,371,614 $ (177,812) $ 1,193,792
Assets $7,210,620 $1,080,028 $1,617,287 $ 911,049 $10,819,004 $(1,132,029) $ 9,686,975
Note: Major countries or areas other than Japan are as follows:
North America ...................U.S.A. and Canada
Europe...............................Germany, France and U.K.
Asia and Other...................Australia, China and Singapore
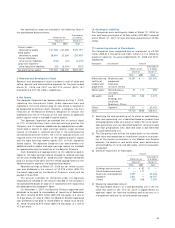
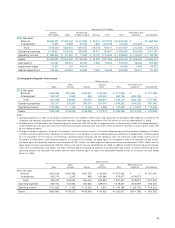
(3) Overseas Sales Thousands of Percentage
Millions of yen U.S. dollars of net sales
2008 2007 2008 2008
North America ¥245,486 ¥257,160 $2,450,205 22.9%
Europe 312,115 279,324 3,115,231 29.1%
Asia and Other 225,182 204,623 2,247,550 21.0%
Notes: 1. Major countries or areas are as follows:
North America ...............U.S.A. and Canada
Europe...........................Germany, France and U.K.
Asia and Other...............Australia, China and Singapore
2. “ Overseas sales” represents sales recognized outside of Japan by the Companies.
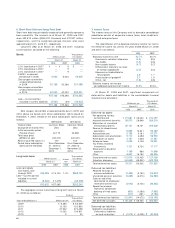
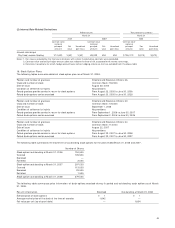
21. Net Income per Share
Calculations of net income per share for the years ended March 31, 2008 and 2007, are as follows:
Thousands of
Millions of yen U.S. dollars
March 31 March 31
2008 2007 2008
Net income
Income attributable to common shares ¥68,829 ¥72,542 $686,985
Income available to common stockholders 68,757 72,518 686,266
Thousands of shares
Weighted average number of common shares outstanding:
Basic 530,660 530,778 530,660
Diluted 561,580 541,168 561,580
Yen U.S. dollars
Net income per common share:
Basic ¥129.71 ¥136.67 $1.29
Diluted 122.44 134.00 1.22
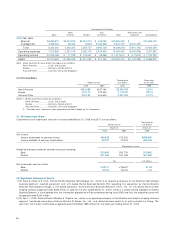
22. Significant Subsequent Events
1) On April 8, 2008 (U.S. time), Konica Minolta Business Technologies, Inc., which is an operating company of the Business Technologies
business segment, reached agreement with U.K.-based Danka Business Systems PLC regarding the acquisition by Konica Minolta
Business Technologies through a U.S.-based subsidiary, Konica Minolta Business Solutions U.S.A., Inc., of U.S.-based Danka Office
Imaging Company (approximately $450 million in sales for the year ended March 31, 2007), which is a wholly owned subsidiary of Danka
Business Systems. It is anticipated that the transaction procedures will be completed during June 2008 and that the acquisition price will
be approximately $240 million.
2) On April 1, 2008, Konica Minolta Medical & Graphic, Inc., which is an operating company of the Medical and Graphic Imaging business
segment, transferred ownership of Konica Minolta ID System Co., Ltd., and related business assets to an entity outside the Group. The
gain from this transfer is estimated at approximately ¥5.8 billion ($58 million) for the fiscal year ending March 31, 2009.