Konica Minolta 2008 Annual Report Download - page 55
Download and view the complete annual report
Please find page 55 of the 2008 Konica Minolta annual report below. You can navigate through the pages in the report by either clicking on the pages listed below, or by using the keyword search tool below to find specific information within the annual report.-
 1
1 -
2
-
3
-
4
-
5
-
6
-
7
-
8
-
9
-
10
-
11
-
12
-
13
-
14
-
15
-
16
-
17
-
18
-
19
-
20
-
21
-
22
-
23
-
24
-
25
-
26
-
27
-
28
-
29
-
30
-
31
-
32
-
33
-
34
-
35
-
36
-
37
-
38
-
39
-
40
-
41
-
42
-
43
-
44
-
 45
45 -
 46
46 -
 47
47 -
 48
48 -
 49
49 -
 50
50 -
 51
51 -
 52
52 -
 53
53 -
 54
54 -
 55
55 -
 56
56 -
 57
57 -
 58
58 -
 59
59 -
 60
60 -
 61
61 -
 62
62 -
 63
63
 |
 |

52
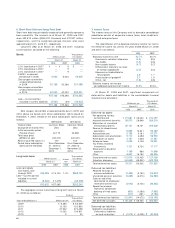
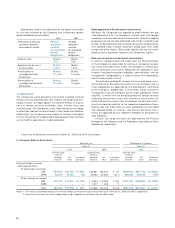
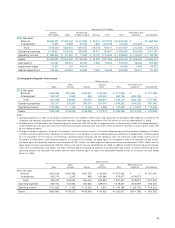
20. Segment Information
(1) Business Segment Information
Business segment information of the Companies for the years ended March 31, 2008 and 2007 is presented as follows:
Business segment Related business segment products
Business Technologies: Copy machines, printers and others
Optics: Optical devices, electronic materials and others
Photo Imaging: Photographic film and materials, ink-jet products, cameras and others
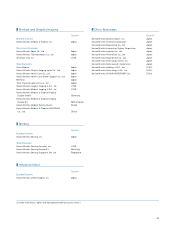
Medical and Graphic Imaging: X-ray and graphic film, equipment for medical or graphic use and others
Sensing: Industrial and medical measurement instruments and others
Other: Others products not categorized in the above segments
Millions of yen
Business Medical and Eliminations and
Technologies Optics Graphic Imaging Sensing Other Total Corporate Consolidated
2008: Net sales
External ¥700,969 ¥182,262 ¥161,105 ¥ 9,910 ¥17,320 ¥1,071,568 ¥ — ¥1,071,568
Intersegment 5,175 1,083 3,566 768 62,798 73,392 (73,392) —
Total 706,145 183,345 164,671 10,678 80,119 1,144,961 (73,392) 1,071,568
Operating expenses 616,051 152,089 156,896 9,460 76,626 1,011,124 (59,162) 951,962
Operating income ¥ 90,093 ¥ 31,255 ¥ 7,775 ¥ 1,218 ¥ 3,493 ¥ 133,836 ¥ (14,229) ¥ 119,606
Assets ¥445,939 ¥181,938 ¥113,141 ¥ 9,505 ¥73,869 ¥ 824,394 ¥146,143 ¥ 970,538
Depreciation 31,286 15,968 6,048 293 1,996 55,593 4,850 60,443
Impairment losses 1,024 21 4,460 — — 5,506 195 5,702
Capital expenditure 16,588 42,012 4,595 370 2,468 66,035 9,259 75,295
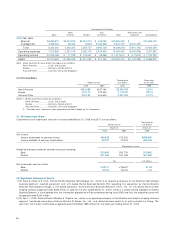
Notes:
1. Operating expenses not able to be properly allocated that are included in Eliminations and Corporate are principally R&D expenses incurred by the
Company and expenses associated with head office functions. Such expenses amounted to ¥30,792 million for the year ended March 31, 2008.
2. Included within the Eliminations and Corporate figure for assets are ¥183,225 million of corporate assets, which primarily include the holding company’s
surplus operating funds (cash and short-term investment securities) and long-term investment funds (investment securities) as well as other assets held
by the holding company.
3. Changes to business segments:
1) The Photo Imaging business was previously listed as a business segment but the importance of that business has decreased due to the discontinua-
tion of that business in accordance with the decision publicly announced on January 19, 2006. Consequently, beginning from the fiscal year under
review, the Photo Imaging business segment is no longer separately listed and is included in the Other segment. As a result of this change, the Other
figure for operating expenses was increased ¥318 million, the Other figure for operating income was reduced by the same figure and the Other
figure for assets was increased ¥23,555 million as of and for the year ended March 31, 2008.
2) A part of the Company’s functions and the Group’s U.S.-based holding company were previously included in the Other segment but following the
reevaluation of the Company as a pure holding company resulting from reorganization measures based on a re-assessment of the functions of the
Group’s shared functions company and the parent company, from the fiscal year under review, these units are included in the Eliminations and
Corporate segment. As a result of this change, the Other figure for intersegment sales was increased ¥9,290 million, the Other figure for operating
expenses was increased ¥13,974 million, the Other figure for operating income was decreased ¥4,683 million and the Other figure for assets was
decreased ¥441,613 million as of and for the year ended March 31, 2008.
Millions of yen
Business Photo Medical and Eliminations and
Technologies Optics Imaging Graphic Imaging Sensing Other Total Corporate Consolidated
2007: Net sales
External ¥658,693 ¥ 138,960 ¥ 47,752 ¥ 158,705 ¥10,003 ¥ 13,516 ¥ 1,027,630 ¥ — ¥1,027,630
Intersegment 3,955 1,396 9,700 12,249 859 58,313 86,476 (86,476) —
Total 662,648 140,356 57,453 170,955 10,863 71,830 1,114,106 (86,476) 1,027,630
Operating expenses 582,666 119,355 58,278 162,074 9,213 60,164 991,753 (68,129) 923,624
Operating income ¥ 79,982 ¥ 21,000 ¥ (825) ¥ 8,880 ¥ 1,649 ¥ 11,665 ¥ 122,353 ¥ (18,346) ¥ 104,006
Assets ¥479,938 ¥ 155,413 ¥ 47,704 ¥ 124,727 ¥10,046 ¥ 486,872 ¥ 1,304,702 ¥ (353,650) ¥ 951,052
Depreciation 30,050 10,806 — 5,138 210 6,487 52,692 — 52,692
Impairment losses 537 46 — — — 56 640 — 640
Capital expenditure 24,510 24,464 — 8,793 400 5,831 64,000 — 64,000