Konica Minolta 2008 Annual Report Download - page 36
Download and view the complete annual report
Please find page 36 of the 2008 Konica Minolta annual report below. You can navigate through the pages in the report by either clicking on the pages listed below, or by using the keyword search tool below to find specific information within the annual report.-
 1
1 -
2
-
3
-
4
-
5
-
6
-
7
-
8
-
9
-
10
-
11
-
12
-
13
-
14
-
15
-
16
-
17
-
18
-
19
-
20
-
21
-
22
-
23
-
24
-
25
-
 26
26 -
 27
27 -
 28
28 -
 29
29 -
 30
30 -
 31
31 -
 32
32 -
 33
33 -
 34
34 -
 35
35 -
 36
36 -
 37
37 -
 38
38 -
 39
39 -
 40
40 -
 41
41 -
 42
42 -
 43
43 -
 44
44 -
 45
45 -
 46
46 -
47
-
48
-
49
-
50
-
51
-
52
-
53
-
54
-
55
-
56
-
57
-
58
-
59
-
60
-
61
-
62
-
63
 |
 |

33
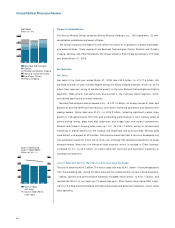
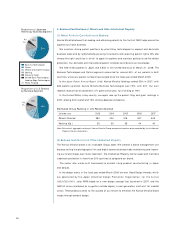
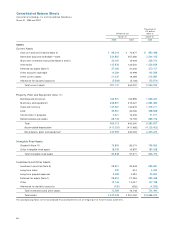
Retained earnings were ¥176.7 billion, up ¥61.0 billion, mainly because from the contribution
of ¥68.8 billion in net income. The unrealized gains on securities, net of taxes, and the foreign
currency translation adjustments were down ¥4.5 billion and ¥6.3 billion, respectively, owing to
sluggish equity markets and a higher yen. Total net assets thus rose ¥49.7 billion. The equity ratio
was 43.0% , up 4.4 percentage points.
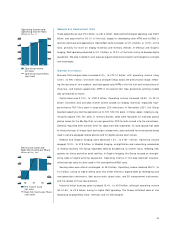
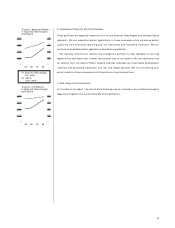
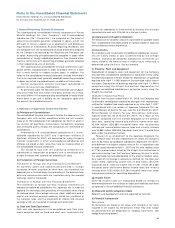
Capital Expenditure and Depreciation and Amortization
Capital expenditure increased ¥11.3 billion, to ¥75.3 billion, mainly to expand production facilities.
Spending for the core Business Technologies business declined ¥7.9 billion, to ¥16.6 billion,
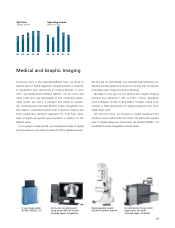
although Optics business allocations rose ¥17.5 billion, to ¥42.0 billion. Medical and Graphic
Imaging business expenditures were ¥4.6 billion.
Noteworthy developments during the term included the construction of a fifth TAC film plant,
in Kobe, Japan, and spending on a glass hard disk substrate facility in Malaysia.
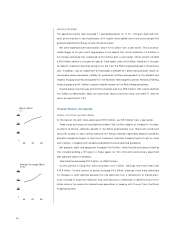
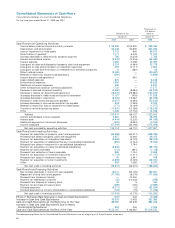
Cash Flows
Net cash provided by operating activities was ¥123.0 billion, up ¥56.3 billion. This reflected lower
outflows from a decrease in reserve for discontinued operations in line with the exit from the
Photo Imaging business and higher inflows from a decrease in trade notes and accounts receivable.
Net cash used in investing activities was ¥76.8 billion, up ¥20.4 billion. This stemmed from
a significant fall in inflows from proceeds from sales of property, plant and equipment, and
outflows from payment for acquisition of newly consolidated subsidiaries.
Net cash used in financing activities was ¥10.5 billion, up ¥5.4 billion. Key factors included an
increase in repayment of long-term loans payable and the restoration of interim cash dividend
payments, which raised dividend outlays.
Cash and cash equivalents at the end of the year were thus ¥122.2 billion, up ¥35.6 billion
from the start of the term.
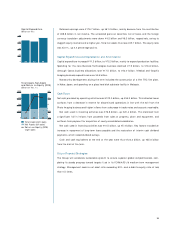
Future Financial Strategies
The Group will accelerate sustainable growth to ensure superior global competitiveness, com-
pleting its steady progress toward targets it set in its FORWARD 08 medium-term management
strategy. Management seeks a net asset ratio exceeding 50% and a debt-to-equity ratio of less
than 0.5 times.
Capital Expenditure
(Billions of Yen)
0
20
40
60
80
06 07 08
Total Assets
(left scale)
Net Assets
(left scale)
Return on Equity (ROE)
(right scale)
Total Assets, Net Assets
and Return on Equity (ROE)
(Billions of Yen, % )
0
250
500
750
1,000
06 07 08
0
15
30
–30
–15