Konica Minolta 2008 Annual Report Download - page 10
Download and view the complete annual report
Please find page 10 of the 2008 Konica Minolta annual report below. You can navigate through the pages in the report by either clicking on the pages listed below, or by using the keyword search tool below to find specific information within the annual report.-
 1
1 -
 2
2 -
 3
3 -
 4
4 -
 5
5 -
 6
6 -
 7
7 -
 8
8 -
 9
9 -
 10
10 -
 11
11 -
 12
12 -
 13
13 -
 14
14 -
 15
15 -
 16
16 -
 17
17 -
 18
18 -
 19
19 -
 20
20 -
 21
21 -
22
-
23
-
24
-
25
-
26
-
27
-
28
-
29
-
30
-
31
-
32
-
33
-
34
-
35
-
36
-
37
-
38
-
39
-
40
-
41
-
42
-
43
-
44
-
45
-
46
-
47
-
48
-
49
-
50
-
51
-
52
-
53
-
54
-
55
-
56
-
57
-
58
-
59
-
60
-
61
-
62
-
63
 |
 |

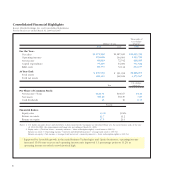
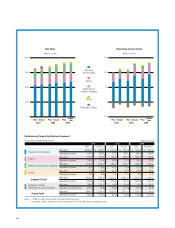
For the Year:
Net sales
Operating income
Net income
Capital expenditure
R&D costs
At Year-End:
Total assets
Total net assets
¥1,027,630
104,006
72,542
64,000
72,142
¥ 951,052
368,624
2008 2007
Millions of yen
Thousands of
U.S. dollars
(Note 1)
2008
Per Share of Common Stock:
Net income—basic
Net assets
Cash dividends
¥136.67
692.39
10
Yen
U.S. dollars
(Note 1)
Financial Ratios:
Equity ratio
Return on assets
Return on equity
38.6%
11.2
21.9
Percent
Notes: 1. U.S. dollar amounts above and elsewhere in this report for the Company are translated from yen, for convenience only, at the rate
of ¥100.19=US$1, the approximate exchange rate prevailing at March 31, 2008.
2. Equity ratio = (Total net assets – minority interests – share subscription rights) ÷ total assets × 100 (%)
Return on assets = (Operating income + interest and dividend income) ÷ average total assets × 100 (%)
Return on equity = Net income ÷ average (total net assets – minority interests – share subscription rights) × 100 (%)
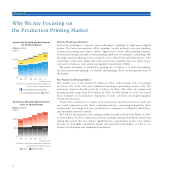
* Supported by favorable growth in the main Business Technologies and Optics businesses, operating income
increased 15.0% year on year and operating income ratio improved 1.1 percentage points to 11.2% as
operating income recorded a new historical high.
¥1,071,568
119,606
68,829
75,295
81,370
¥ 970,538
418,310
$10,695,359
1,193,792
686,985
751,522
812,157
$9,686,975
4,175,167
¥129.71
786.20
15
43.0%
12.7
17.5
*
Consolidated Financial Highlights
Konica Minolta Holdings, Inc. and Consolidated Subsidiaries
For the fiscal years ended March 31, 2008 and 2007
$1.29
7.85
0.15
8