Konica Minolta 2008 Annual Report Download - page 15
Download and view the complete annual report
Please find page 15 of the 2008 Konica Minolta annual report below. You can navigate through the pages in the report by either clicking on the pages listed below, or by using the keyword search tool below to find specific information within the annual report.-
 1
1 -
2
-
3
-
4
-
 5
5 -
 6
6 -
 7
7 -
 8
8 -
 9
9 -
 10
10 -
 11
11 -
 12
12 -
 13
13 -
 14
14 -
 15
15 -
 16
16 -
 17
17 -
 18
18 -
 19
19 -
 20
20 -
 21
21 -
 22
22 -
 23
23 -
 24
24 -
 25
25 -
26
-
27
-
28
-
29
-
30
-
31
-
32
-
33
-
34
-
35
-
36
-
37
-
38
-
39
-
40
-
41
-
42
-
43
-
44
-
45
-
46
-
47
-
48
-
49
-
50
-
51
-
52
-
53
-
54
-
55
-
56
-
57
-
58
-
59
-
60
-
61
-
62
-
63
 |
 |

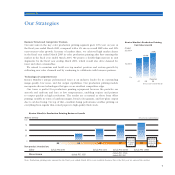
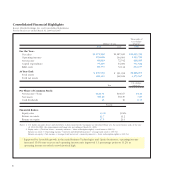
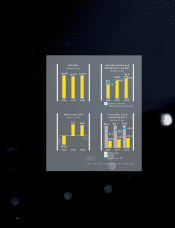
12
Operating income
Operating income ratio (%)
2006 2007 2008
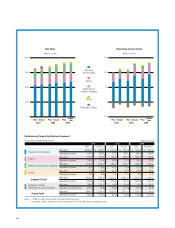
Net Sales
(Billions of Yen)
1,068.4 1,027.6 1,071.6
2006 2007 2008
Net Income (Loss)
(Billions of Yen)
72.5
(54.3)
68.8
Total assets
Equity*
Equity ratio (%)
* Equity = Total net assets – minority interests – share subscription rights
2006 2007 2008
Total Assets, Equity
and Equity Ratio
(Billions of Yen)
293.8
951.1
944.1
367.5
970.5
417.2
2006 2007 2008
Operating Income and
Operating Income Ratio
(Billions of Yen)
83.4
7.8
104.0
10.1
11.2
119.6
31.1
38.6
43.0