Konica Minolta 2008 Annual Report Download - page 35
Download and view the complete annual report
Please find page 35 of the 2008 Konica Minolta annual report below. You can navigate through the pages in the report by either clicking on the pages listed below, or by using the keyword search tool below to find specific information within the annual report.-
 1
1 -
2
-
3
-
4
-
5
-
6
-
7
-
8
-
9
-
10
-
11
-
12
-
13
-
14
-
15
-
16
-
17
-
18
-
19
-
20
-
21
-
22
-
23
-
24
-
 25
25 -
 26
26 -
 27
27 -
 28
28 -
 29
29 -
 30
30 -
 31
31 -
 32
32 -
 33
33 -
 34
34 -
 35
35 -
 36
36 -
 37
37 -
 38
38 -
 39
39 -
 40
40 -
 41
41 -
 42
42 -
 43
43 -
 44
44 -
 45
45 -
46
-
47
-
48
-
49
-
50
-
51
-
52
-
53
-
54
-
55
-
56
-
57
-
58
-
59
-
60
-
61
-
62
-
63
 |
 |

32
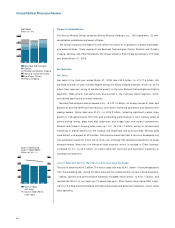
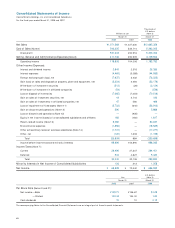
Earnings Analysis
The operating income ratio increased 1.1 percentage points, to 11.2% . This gain stemmed from
solid performances in core businesses, with higher-value-added and more price-competitive
products enabling the Group to raise the gross margin.
Net other expenses were ¥20.6 billion, down ¥21.5 billion from a year earlier. This was attrib-
utable largely to the yen’s swift appreciation in the second half, which resulted in ¥7.6 billion in
net foreign exchange loss, compared to ¥3.4 billion gain a year earlier. Other factors included
a ¥6.0 billion decline in the gain on sales of fixed assets, and a ¥2.8 billion reduction in the gain
on sales of investment securities owing to our exit from the Photo Imaging business in the previous
year. In addition, loss on impairment of fixed assets increased ¥5.1 billion because book values for
recoverable values decreased, notably for production facilities and goodwill in the Medical and
Graphic Imaging business and goodwill in the Business Technologies business. Partially offsetting
these changes was ¥8.1 billion in patent-related income for the Photo Imaging business.
Income before income taxes and minority interests was thus ¥99.0 billion. Net income declined
¥3.7 billion to ¥68.8 billion. Basic net income per share of common stock was ¥129.71, and the
return on equity was 17.5% .
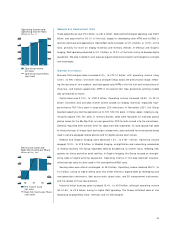
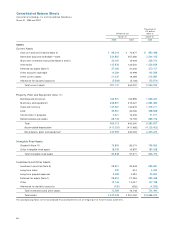
Financial Position and Liquidity
Assets, Liabilities, and Net Assets
At the close of the term, total assets were ¥970.5 billion, up ¥19.5 billion from a year earlier.
Trade notes and accounts receivable were down ¥22.5 billion despite an increase in net sales,
as efforts to shorten collection periods in the Optics business bore fruit. Short-term investment
securities surged to ¥33.0 billion because the Group restated negotiable deposits issued by
domestic companies as part of short-term investment securities, instead of part of cash on hand
and in banks, in keeping with revised consolidated financial reporting guidelines.
Net property, plant and equipment increased ¥15.9 billion, reflecting Optics business initiatives
that included building a fifth plant, in Kobe, Japan, for TAC films and constructing a glass hard
disk substrate facility in Malaysia.
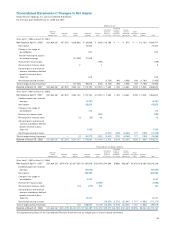
Total liabilities decreased ¥30.2 billion, to ¥552.2 billion.
Current portion of long-term loans was down ¥10.7 billion, although short-term debt rose
¥13.9 billion. Current portion of bonds increased ¥5.0 billion, although there were effectively
no changes to total liabilities because this rise stemmed from a restatement of bonds previ-
ously included in long-term liabilities. Also contributing to a decrease in liabilities was a ¥16.4
billion drop in the reserve for discontinued operations in keeping with the exit from the Photo
Imaging business.
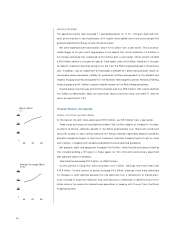
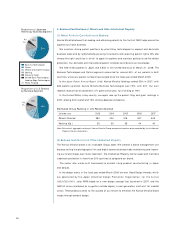
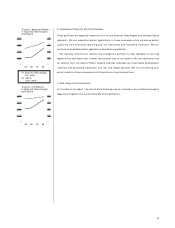
Equity Ratio
(% )
06 07 08
0
45
30
15
Interest Coverage Ratio
(Times)
06 07 08
0
10
20
30