Konica Minolta 2008 Annual Report Download - page 56
Download and view the complete annual report
Please find page 56 of the 2008 Konica Minolta annual report below. You can navigate through the pages in the report by either clicking on the pages listed below, or by using the keyword search tool below to find specific information within the annual report.-
 1
1 -
2
-
3
-
4
-
5
-
6
-
7
-
8
-
9
-
10
-
11
-
12
-
13
-
14
-
15
-
16
-
17
-
18
-
19
-
20
-
21
-
22
-
23
-
24
-
25
-
26
-
27
-
28
-
29
-
30
-
31
-
32
-
33
-
34
-
35
-
36
-
37
-
38
-
39
-
40
-
41
-
42
-
43
-
44
-
45
-
 46
46 -
 47
47 -
 48
48 -
 49
49 -
 50
50 -
 51
51 -
 52
52 -
 53
53 -
 54
54 -
 55
55 -
 56
56 -
 57
57 -
 58
58 -
 59
59 -
 60
60 -
 61
61 -
 62
62 -
 63
63
 |
 |

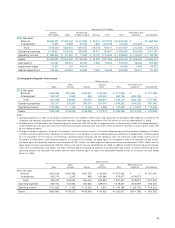
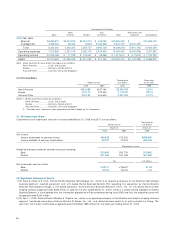
53
Thousands of U.S. dollars
Business Medical and Eliminations and
Technologies Optics Graphic Imaging Sensing Other Total Corporate Consolidated
2008: Net sales
External $6,996,397 $1,819,164 $1,607,995 $ 98,912 $172,872 $10,695,359 $ — $10,695,359
Intersegment 51,652 10,809 35,592 7,665 626,789 732,528 (732,528) —
Total 7,048,059 1,829,973 1,643,587 106,578 799,671 11,427,897 (732,528) 10,695,359
Operating expenses 6,148,827 1,518,006 1,565,985 94,421 764,807 10,092,065 (590,498) 9,501,567
Operating income $ 899,221 $ 311,957 $ 77,603 $ 12,157 $ 34,864 $ 1,335,822 $ (142,020) $ 1,193,792
Assets $4,450,933 $1,815,930 $1,129,264 $ 94,870 $737,289 $ 8,228,306 $1,458,659 $ 9,686,975
Depreciation 312,267 159,377 60,365 2,924 19,922 554,876 48,408 603,284
Impairment losses 10,221 210 44,515 — — 54,956 1,946 56,912
Capital expenditure 165,565 419,323 45,863 3,693 24,633 659,098 92,414 751,522
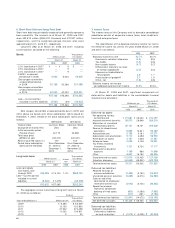
(2) Geographic Segment Information
Millions of yen
North Asia and Eliminations and
Japan America Europe Other Total Corporate Consolidated
2008: Net sales
External ¥469,989 ¥233,834 ¥305,687 ¥ 62,056 ¥1,071,568 ¥ — ¥1,071,568
Intersegment 353,597 2,848 868 204,822 562,136 (562,136) —
Total 823,586 236,683 306,555 266,879 1,633,704 (562,136) 1,071,568
Operating expenses 702,701 235,561 296,079 261,940 1,496,282 (544,320) 951,962
Operating income ¥120,885 ¥ 1,122 ¥ 10,476 ¥ 4,938 ¥ 137,422 ¥ (17,815) ¥ 119,606
Assets ¥722,432 ¥108,208 ¥162,036 ¥ 91,278 ¥1,083,956 ¥(113,418) ¥ 970,538
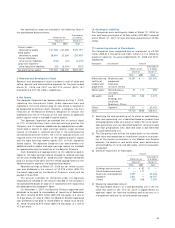
Notes:
1. Operating expenses not able to be properly allocated that are included in Eliminations and Corporate are principally R&D expenses incurred by the
Company and expenses associated with head office functions. Such expenses amounted to ¥30,792 million for the year ended March 31, 2008.
2. Included within the Eliminations and Corporate figure for assets are ¥183,225 million of corporate assets, which primarily include the holding company’s
surplus operating funds (cash and short-term investment securities) and long-term investment funds (investment securities) as well as other assets held
by the holding company.
3. Changes to business segments: A part of the Company’s functions and the Group’s U.S. based holding company were previously included in the Japan
and North America segments but, following the reevaluation of the Company as a pure holding company resulting from reorganization measures based
on a re-assessment of the functions of the Group’s shared functions company and the Company, from the fiscal year under review, these units are
included in the Eliminations and Corporate segment. As a result of this change, the Japan figure for intersegment sales was increased ¥23,065 million,
the Japan figure for operating expenses was increased ¥27,947 million, the Japan figure for operating income was decreased ¥4,881 million and the
Japan figure for assets was decreased ¥165,221 million as of and for the year ended March 31, 2008. In addition the North America figure for interseg-
ment sales was decreased ¥146 million, the North America figure for operating expenses was decreased ¥223 million, the North America figure for
operating income was increased ¥76 million and the North America figure for assets was decreased ¥46,823 million as of and for the year ended
March 31, 2008.
Millions of yen
North Asia Eliminations and
Japan America Europe and Other Total Corporate Consolidated
2007: Net sales
External ¥460,196 ¥246,786 ¥263,702 ¥ 56,945 ¥1,027,630 ¥ — ¥1,027,630
Intersegment 292,774 2,247 969 183,885 479,877 (479,877) —
Total 752,970 249,033 264,672 240,830 1,507,507 (479,877) 1,027,630
Operating expenses 639,740 244,932 254,632 239,016 1,378,321 (454,697) 923,624
Operating income ¥113,230 ¥ 4,100 ¥ 10,040 ¥ 1,814 ¥ 129,186 ¥ (25,179) ¥ 104,006
Assets ¥865,962 ¥179,007 ¥155,426 ¥ 92,420 ¥1,292,817 ¥(341,765) ¥ 951,052