Konica Minolta 2008 Annual Report Download - page 34
Download and view the complete annual report
Please find page 34 of the 2008 Konica Minolta annual report below. You can navigate through the pages in the report by either clicking on the pages listed below, or by using the keyword search tool below to find specific information within the annual report.-
 1
1 -
2
-
3
-
4
-
5
-
6
-
7
-
8
-
9
-
10
-
11
-
12
-
13
-
14
-
15
-
16
-
17
-
18
-
19
-
20
-
21
-
22
-
23
-
 24
24 -
 25
25 -
 26
26 -
 27
27 -
 28
28 -
 29
29 -
 30
30 -
 31
31 -
 32
32 -
 33
33 -
 34
34 -
 35
35 -
 36
36 -
 37
37 -
 38
38 -
 39
39 -
 40
40 -
 41
41 -
 42
42 -
 43
43 -
 44
44 -
45
-
46
-
47
-
48
-
49
-
50
-
51
-
52
-
53
-
54
-
55
-
56
-
57
-
58
-
59
-
60
-
61
-
62
-
63
 |
 |

31
Research and Development Costs
These expenditures rose ¥9.2 billion, to ¥81.4 billion. Business Technologies spending was ¥48.9
billion, and accounted for 60.1% of the total, largely for developing color MFPs and for R&D in
solutions software and applications. Optics R&D costs increased, to ¥11.0 billion, or 13.5% of the
total, primarily for work on display materials and memory devices. In Medical and Graphic
Imaging, R&D spending advanced to ¥11.3 billion, or 13.9% of the total, mainly to develop digital
equipment. We also invested in such areas as organic electroluminescent technologies to cultivate
new businesses.
Segment Information
Business Technologies sales increased 6.4% , to ¥701.0 billion, with operating income rising
12.6% , to ¥90.1 billion. One driver was a stronger lineup across the performance range, reflect-
ing the launches of two medium- and high-speed color MFPs in the first half and introductions of
three low- and medium-speed color MFPs in the second half. New production printing models
also contributed to results.
Optics sales rose 31.2% , to ¥182.3 billion. Operating income increased 48.8% , to ¥31.3
billion. Domestic and overseas market shares surged for display materials, especially high-
performance TAC films used in large-screen LCD televisions. In November 2007, the Group
boosted capacity by starting operations at its fifth TAC film plant, in Kobe, Japan, helping to sig-
nificantly expand TAC film sales. In memory devices, sales were favorable for mainstay optical
pickup lenses for the Blu-Ray Disk, as next-generation DVD formats moved into the mainstream.
Demand recovered after summer 2007 for glass hard disk substrates, for solid second-half sales
of these offerings. In image input and output components, sales rocketed for microcamera lenses
used in camera-equipped mobile phones and for digital camera zoom lenses.
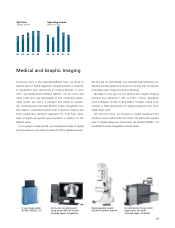
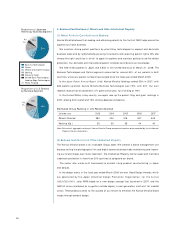
Medical and Graphic Imaging sales advanced 1.5% , to ¥161.1 billion. Operating income
dropped 12.4% , to ¥7.8 billion. In Medical Imaging, as digitization and networking accelerated
at medical facilities, the Group expanded sales by broadening its market focus, releasing new
systems for clinics and other small facilities. In Graphic Imaging, the Group focused on strength-
ening sales of digital printing equipment. Operating income in this area declined, however,
reflecting high costs for silver used in film and additional R&D costs.
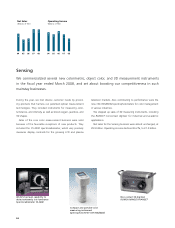
Sensing sales were almost unchanged, at ¥9.9 billion. Operating income declined 26.2% , to
¥1.2 billion, owing to higher selling costs that offset efforts to expand sales by developing core
next-generation colorimetric, light source color, object color, and 3D measurement instruments,
and the release of three new products.
Industrial Inkjet business sales increased 15.4% , to ¥6.9 billion, although operating income
fell 31.8% , to ¥0.9 billion, owing to higher R&D spending. The Group cultivated sales of inks
employing its proprietary inkjet, chemical, and ink technologies.
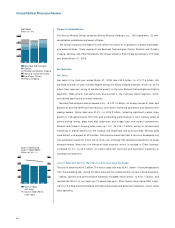
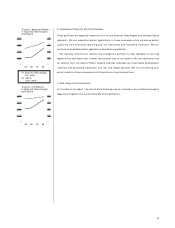
Operating Income
(left scale)
Operating Income Ratio
(right scale)
Operating Income and
Operating Income Ratio
(Billions of Yen, % )
0
30
60
90
120
06 07 08 0
3
6
9
12
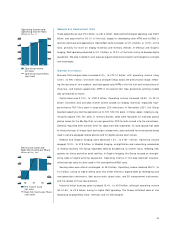
Net Income (Loss)
(left scale)
Basic Net Income per Share
(right scale)
Net Income (Loss) and
Basic Net Income per Share
(Billions of Yen, Yen)
–80
–40
0
40
80
06 07 08 –150
–75
0
75
150