Konica Minolta 2008 Annual Report Download - page 33
Download and view the complete annual report
Please find page 33 of the 2008 Konica Minolta annual report below. You can navigate through the pages in the report by either clicking on the pages listed below, or by using the keyword search tool below to find specific information within the annual report.-
 1
1 -
2
-
3
-
4
-
5
-
6
-
7
-
8
-
9
-
10
-
11
-
12
-
13
-
14
-
15
-
16
-
17
-
18
-
19
-
20
-
21
-
22
-
 23
23 -
 24
24 -
 25
25 -
 26
26 -
 27
27 -
 28
28 -
 29
29 -
 30
30 -
 31
31 -
 32
32 -
 33
33 -
 34
34 -
 35
35 -
 36
36 -
 37
37 -
 38
38 -
 39
39 -
 40
40 -
 41
41 -
 42
42 -
 43
43 -
44
-
45
-
46
-
47
-
48
-
49
-
50
-
51
-
52
-
53
-
54
-
55
-
56
-
57
-
58
-
59
-
60
-
61
-
62
-
63
 |
 |

30
Consolidated Financial Review
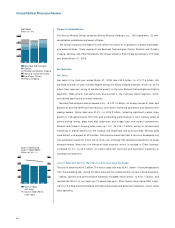
Scope of Consolidation
The Konica Minolta Group comprises Konica Minolta Holdings, Inc., 108 subsidiaries, 23 non-
consolidated subsidiaries and seven affiliates.
The Group maintains five segments that reflect the nature of its products, markets, businesses,
and administration. These segments are Business Technologies, Optics, Medical and Graphic
Imaging, Sensing, and Other Businesses. The Group exited its Photo Imaging business in the fiscal
year ended March 31, 2008.
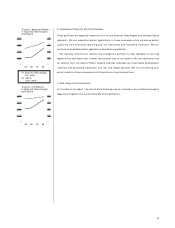
Performance
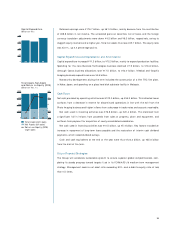
Net Sales
Net sales in the fiscal year ended March 31, 2008 rose ¥43.9 billion, to ¥1,071.6 billion. We
achieved this year-on-year increase despite exiting the Photo Imaging business, which cut ¥47.8
billion from revenues, owing to substantial growth in the core Business Technologies and Optics
segments. Sales growth was particularly pronounced in the mainstay Optics segment, which
contributed significantly to overall revenues.
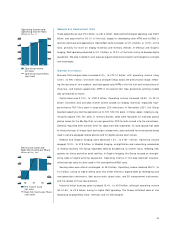
Business Technologies sales increased 6.4% , to ¥701.0 billion, on strong lineups of color and
production printing MFPs and contributions from direct marketing operations and alliances with
leading dealers. Optics sales rose 31.2% , to ¥182.3 billion, reflecting significant market share
growth in high-performance TAC films and outstanding performances in such memory areas as
optical pickup lenses, glass hard disk substrates, and image input and output components.
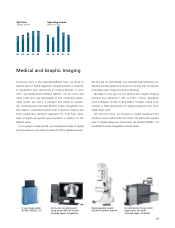
Medical and Graphic Imaging sales were up 1.5% , to ¥161.1 billion, owing to concentrated
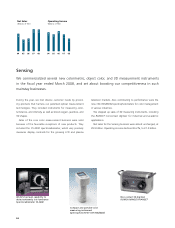
marketing of digital systems for the medical and healthcare and printing fields. Sensing sales
were almost unchanged, at ¥9.9 billion. Performance benefited from a focus on developing key
next-generation products, which led to three new offerings that complemented efforts to boost
competitiveness. Sales from the Industrial Inkjet business, which is included in Other business,
increased 15.4% , to ¥6.9 billion, on higher domestic revenues and successful marketing to
overseas manufacturers.
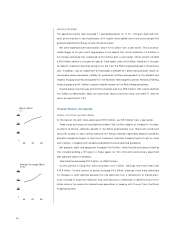
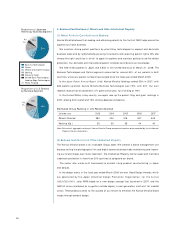
Cost of Sales and Selling, General and Administrative Expenses
The cost of sales was ¥540.2 billion. The cost of sales ratio was 50.4% , down 1.4 percentage points
from the preceding year, owing to higher sales and the implementation of cost-cutting programs.
Selling, general and administrative expenses increased ¥20.8 billion, to ¥411.7 billion, and
represented 38.4% of net sales, up 0.3 percentage point. Main factors were higher R&D invest-
ments in the Business Technologies and Optics businesses and personnel expansion, which raised
labor spending.
Business Technologies
Optics
Medical and Graphic Imaging
Sensing, Industrial Inkjet
Holdings, Others
Photo Imaging
Net Sales
(Billions of Yen)
0
300
600
900
1,200
06 07 08
Cost of Sales
(left scale)
Cost of Sales Ratio
(right scale)
Cost of Sales and
Cost of Sales Ratio
(Billions of Yen, % )
0
15
30
45
60
0
200
400
600
800
06 07 08