Konica Minolta 2005 Annual Report Download - page 54
Download and view the complete annual report
Please find page 54 of the 2005 Konica Minolta annual report below. You can navigate through the pages in the report by either clicking on the pages listed below, or by using the keyword search tool below to find specific information within the annual report.-
 1
1 -
2
-
3
-
4
-
5
-
6
-
7
-
8
-
9
-
10
-
11
-
12
-
13
-
14
-
15
-
16
-
17
-
18
-
19
-
20
-
21
-
22
-
23
-
24
-
25
-
26
-
27
-
28
-
29
-
30
-
31
-
32
-
33
-
34
-
35
-
36
-
37
-
38
-
39
-
40
-
41
-
42
-
43
-
 44
44 -
 45
45 -
 46
46 -
 47
47 -
 48
48 -
 49
49 -
 50
50 -
 51
51 -
 52
52 -
 53
53 -
 54
54 -
 55
55 -
 56
56 -
 57
57 -
 58
58 -
 59
59 -
 60
60
 |
 |

52
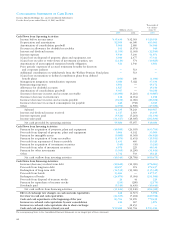
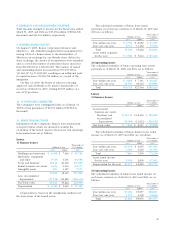
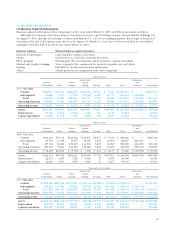
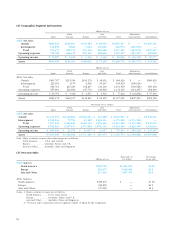
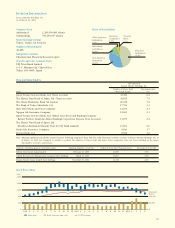
(2) Geographic Segment Information
Millions of yen
North Asia Elimination
Japan America Europe and Other Total and Corporate Consolidation
2005: Net sales
Outside ¥480,522 ¥250,207 ¥278,164 ¥ 58,552 ¥1,067,447 ¥ — ¥1,067,447
Intersegment 313,852 8,565 1,624 145,636 469,679 (469,679) —
Total 794,375 258,773 279,789 204,188 1,537,127 (469,679) 1,067,447
Operating expenses 719,788 256,412 276,369 200,856 1,453,427 (453,557) 999,869
Operating income ¥ 74,587 ¥ 2,360 ¥ 3,419 ¥ 3,332 ¥ 83,699 ¥ (16,122) ¥ 67,577
Assets ¥819,494 ¥154,093 ¥158,021 ¥ 75,106 ¥1,206,715 ¥ (251,173) ¥ 955,542
Millions of yen
North Asia Elimination
Japan America Europe and Other Total and Corporate Consolidation
2004: Net sales
Outside ¥405,787 ¥215,554 ¥190,178 ¥ 48,901 ¥ 860,420 ¥ — ¥860,420
Intersegment 223,931 9,678 2,069 95,247 330,928 (330,928) —
Total 629,719 225,233 192,247 144,148 1,191,348 (330,928) 860,420
Operating expenses 565,964 220,802 187,730 139,638 1,114,136 (311,245) 802,890
Operating income ¥ 63,754 ¥ 4,430 ¥ 4,517 ¥ 4,510 ¥ 77,212 ¥ (19,682) ¥ 57,530
Assets ¥835,472 ¥148,317 ¥146,841 ¥ 66,459 ¥1,197,091 ¥(227,501) ¥969,589
Thousands of U.S. dollars
North Asia Elimination
Japan America Europe and Other Total and Corporate Consolidation
2005: Net sales
Outside $4,474,551 $2,329,891 $2,590,223 $ 545,228 $ 9,939,911 $ — $9,939,911
Intersegment 2,922,544 79,756 15,122 1,356,141 4,373,582 (4,373,582) —
Total 7,397,104 2,409,656 2,605,354 1,901,369 14,313,502 (4,373,582) 9,939,911
Operating expenses 6,702,561 2,387,671 2,573,508 1,870,,342 13,534,100 (4,223,457) 9,310,634
Operating income $ 694,543 $ 21,976 $ 31,837 $ 31,027 $ 779,393 $ (150,126) $ 629,267
Assets $7,631,008 $1,434,892 $1,471,468 $ 699,376 $11,236,754 $(2,338,886) $8,897,868
Note: Major countries or areas other than Japan are as follows:
North America ............U.S.A. and Canada
Europe ........................Germany, France and U.K.
Asia and Other ...........Australia, China and Singapore
(3) Overseas Sales
Thousands of Percentage
Millions of yen U.S. dollars of net sales
2005: Sales to
North America ¥264,718 $2,465,015 24.8%
Europe 282,475 2,630,366 26.5
Asia and Other 213,435 1,987,476 20.0
2004: Sales to
North America ¥235,270 $ — 27.3%
Europe 210,899 — 24.5
Asia and Other 157,038 — 18.3
Notes: 1. Major countries or areas are as follows:
North America ............U.S.A. and Canada
Europe ........................Germany, France and U.K.
Asia and Other ...........Australia, China and Singapore
2. “Overseas sales” represents sales recognized outside of Japan by the Companies.