Konica Minolta 2005 Annual Report Download - page 34
Download and view the complete annual report
Please find page 34 of the 2005 Konica Minolta annual report below. You can navigate through the pages in the report by either clicking on the pages listed below, or by using the keyword search tool below to find specific information within the annual report.-
 1
1 -
2
-
3
-
4
-
5
-
6
-
7
-
8
-
9
-
10
-
11
-
12
-
13
-
14
-
15
-
16
-
17
-
18
-
19
-
20
-
21
-
22
-
23
-
 24
24 -
 25
25 -
 26
26 -
 27
27 -
 28
28 -
 29
29 -
 30
30 -
 31
31 -
 32
32 -
 33
33 -
 34
34 -
 35
35 -
 36
36 -
 37
37 -
 38
38 -
 39
39 -
 40
40 -
 41
41 -
 42
42 -
 43
43 -
 44
44 -
45
-
46
-
47
-
48
-
49
-
50
-
51
-
52
-
53
-
54
-
55
-
56
-
57
-
58
-
59
-
60
 |
 |

32
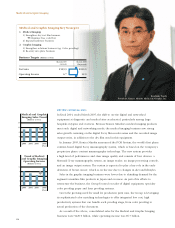
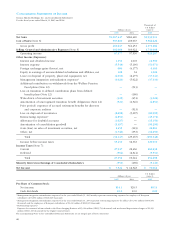
Earnings Analysis
Adjusted operating income for the fiscal year ended March 31, 2005 was ¥67.6
billion, representing a slight increase compared to previous fiscal year.
Net other expenses were ¥32.1 billion and basically unchanged from the previous
fiscal year. The major factors were a ¥5.7 billion swing from foreign exchange losses
in the previous fiscal year to foreign exchange gains and a ¥2.0 billion decline in
interest expenses accompanying a decline in interest-bearing debt. On the other
hand, ¥4.9 billion of restructuring expenses were recorded for the Photo Imaging
segment, and a one-time depreciation adjustment of ¥5.4 billion was also recorded
for the camera business. As a result of the above, income before income taxes was
¥35.4 billion, and net income for the period was ¥7.5 billion. Earnings per share of
common stock were ¥14.1 per share, while return on equity was 2.2%.
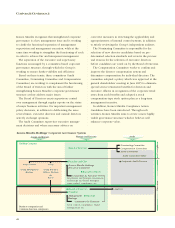
Major Factors Inhibiting Direct Increase/Decrease Comparison (Operating Income)
Transactions
Foreign Change in Between Change in Actual
Exchange Accounting Prior Segment Total Increase,
Impact Period Companies Content Impact Decline
Business Technologies –0.9 –1 –2.1 0 –4.0 –3.0
Optics –0.8 –0.6 –0.1 0 –1.5 2.3
Photo Imaging 0.2 –0.1 –0.1 0.2 0.2 –2.1
Medical and Graphic Imaging –0.7 0 0 0 –0.7 –0.6
Sensing 0 0 –0.1 –0.2 –0.3 0.1
Other 0.1 0 0 0 0.1 4.0
Total -2.2 -1.7 -2.4 0 -6.3 0.7
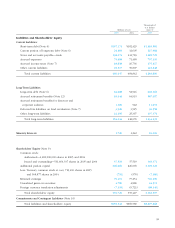
LIQUIDITY AND FINANCIAL POSITION
Total Assets, Liabilities and Shareholders’ Equity
Total assets at the end of the fiscal year declined by ¥14.0 billion to ¥955.5 billion.
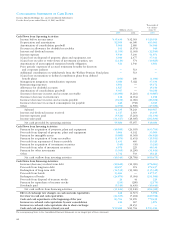
Within current assets, cash on hand and in banks declined by ¥24.2 billion as cash
on hand was lowered to more appropriate levels and used to repay interest-bearing
debt. In addition, as sales were concentrated in the final month of the fiscal year,
notes and accounts receivable and inventories rose by ¥20.1 billion and ¥3.6 billion
respectively. Deferred tax assets rose by ¥6.8 billion based on the assumption that
consolidated taxation will be introduced from the fiscal year ending March 31, 2006.
Within property, plant and equipment, land holdings increased by ¥2.4 billion for
the fiscal year. Buildings and structures were ¥4.6 billion higher for the fiscal year,
reflecting the construction of a third LCD-use TAC film factory, and an R&D building
for materials technology development. Machinery, equipment and other declined by
¥1.3 billion. While capital expenditure was increased in strategic areas such as
polymerized toner production facilities in the Business Technologies segment and
LCD-use TAC film production facilities in the Optics segment, capital expenditure in
the Other segment was restrained. In addition, tools and furniture increased by ¥15.5
billion owing to investment in metal molding for new product development.
Total investments and other assets declined by ¥12.8 billion for the fiscal year
because of efforts to reduce holdings of marketable securities. In addition, deferred
tax assets declined ¥4.9 billion, mainly due to transfers to current assets.
Within total liabilities, interest-bearing debt declined by ¥21.6 billion from the
20042003 2005
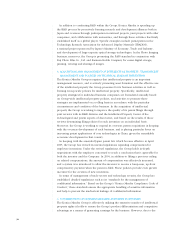
Interest Coverage
Ratio
(times)
0
16
12
8
4
20042003 2005
Equity Ratio
(%)
0
1,000
750
500
250
0
10.0
7.5
5.0
2.5
20042003 2005
Total Assets,
Shareholders’ Equity
and ROE
(¥ billions, %)
0
1,000
750
500
250
Total Assets
Shareholders’ Equity
Return on Equity
0
10.0
7.5
5.0
2.5