Konica Minolta 2005 Annual Report Download - page 32
Download and view the complete annual report
Please find page 32 of the 2005 Konica Minolta annual report below. You can navigate through the pages in the report by either clicking on the pages listed below, or by using the keyword search tool below to find specific information within the annual report.-
 1
1 -
2
-
3
-
4
-
5
-
6
-
7
-
8
-
9
-
10
-
11
-
12
-
13
-
14
-
15
-
16
-
17
-
18
-
19
-
20
-
21
-
 22
22 -
 23
23 -
 24
24 -
 25
25 -
 26
26 -
 27
27 -
 28
28 -
 29
29 -
 30
30 -
 31
31 -
 32
32 -
 33
33 -
 34
34 -
 35
35 -
 36
36 -
 37
37 -
 38
38 -
 39
39 -
 40
40 -
 41
41 -
 42
42 -
43
-
44
-
45
-
46
-
47
-
48
-
49
-
50
-
51
-
52
-
53
-
54
-
55
-
56
-
57
-
58
-
59
-
60
 |
 |

30
CONSOLIDATED FINANCIAL REVIEW
SCOPE OF CONSOLIDATED FINANCIAL RESULTS
The Konica Minolta Group comprises Konica Minolta Holdings, Inc., and it’s 122
consolidated subsidiaries, 33 unconsolidated subsidiaries and 9 affiliated companies.
The business segments of the Konica Minolta Group are organized and segmented
by type of product and the markets in which these products are sold, and consist of
six segments: Business Technologies, Optics, Photo Imaging, Medical and Graphic
Imaging, Sensing, and Other Businesses.
YEAR-ON-YEAR COMPARISONS
The financial statements for the fiscal year ended March 31, 2004 do not include pre-
merger Minolta for the first half ended September 30, 2003. As a result, comparisons
with the fiscal year ended March 31, 2004 that are included in this report are made
based on the simple totals of former Konica and former Minolta and, where noted,
are included net of appropriate adjustments.
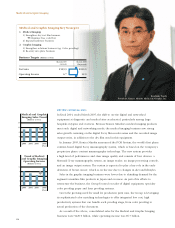
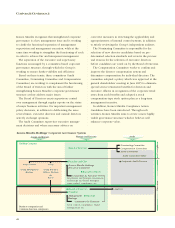
CONSOLIDATED BUSINESS RESULTS
Consolidated Net Sales
Consolidated net sales for the fiscal
year ended March 31, 2005 were
¥1,067.4 billion. Compared with the
simple combined sales for both
companies in the previous fiscal year,
which represented the first fiscal year
after the merger, this represents a decline of ¥17.2 billion after adjusting for
the unification of overseas subsidiary accounting periods and transactions between
former Konica and former Minolta, as well as the impact of exchange rates.
In terms of actual increase and decrease by business segment, growth in sales of
the Business Technologies segment was essentially flat compared to the previous
fiscal year, while the Optics, Medical and Graphic Imaging, and Sensing segments
recorded increases from the previous fiscal year.
On the other hand, adjusted sales for the Photo Imaging segment declined.
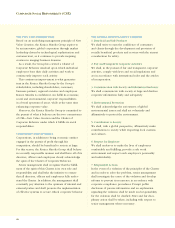
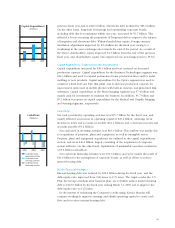
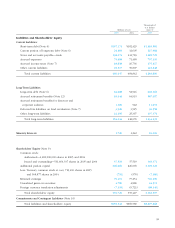
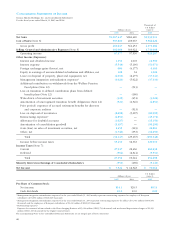
Cost of Sales and Selling, General and Administrative Expenses
The cost of sales for the fiscal year was ¥597.8 billion, which resulted in a gross profit
of ¥469.6 billion. Compared to the previous fiscal year, which is based on the simple
total of both companies, this represents a 1.4 percentage point improvement in gross
margin due to cost reductions and other factors.
Selling, general and administrative expenses (SGA) were ¥402.1 billion.
Rationalization effects from the merger resulted in a ¥11.9 billion decline in personnel
expenses (or ¥14.1 billion including personnel costs recorded in the cost of sales),
increased costs from active research and development and an increase in the
consolidation goodwill account limited the overall increase in SGA to a slight decline.
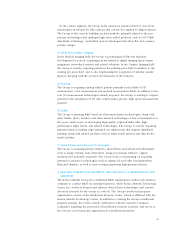
Research and Development Expenditures
Total research and development expenditures were ¥66.0 billion, which represents a
4% increase over the previous fiscal year.
In the Business Technologies segment, R&D expenditures increased 14% year-on-
year to ¥33.7 billion, mainly on the development of new integrated firmware
compatible with diverse office network environments. In addition, R&D in the Optics
Cost of Sales
Cost of Sales Ratio
Cost of Sales and
Cost of Sales Ratio
(¥ billions, %)
0
800
0
60
600 45
400 30
200 15
2004 20052003
Research
and Development
Expenditures
(¥ billions)
0
80
60
40
20
20042003 2005
Consolidated Total Billions of yen
Value
2005 2004 change
Net Sales 1,067.4 1,123.6 -56.2
Operating Income 67.6 73.2 -5.6
Net Income 7.5 19.3 -11.8
* Includes former Minolta totals for first half FY2004
Note: Figures for the March 2003
fiscal year in this report,
excluding the finance
statements, represent former
Konica figures only.