Konica Minolta 2005 Annual Report Download - page 33
Download and view the complete annual report
Please find page 33 of the 2005 Konica Minolta annual report below. You can navigate through the pages in the report by either clicking on the pages listed below, or by using the keyword search tool below to find specific information within the annual report.-
 1
1 -
2
-
3
-
4
-
5
-
6
-
7
-
8
-
9
-
10
-
11
-
12
-
13
-
14
-
15
-
16
-
17
-
18
-
19
-
20
-
21
-
22
-
 23
23 -
 24
24 -
 25
25 -
 26
26 -
 27
27 -
 28
28 -
 29
29 -
 30
30 -
 31
31 -
 32
32 -
 33
33 -
 34
34 -
 35
35 -
 36
36 -
 37
37 -
 38
38 -
 39
39 -
 40
40 -
 41
41 -
 42
42 -
 43
43 -
44
-
45
-
46
-
47
-
48
-
49
-
50
-
51
-
52
-
53
-
54
-
55
-
56
-
57
-
58
-
59
-
60
 |
 |
31
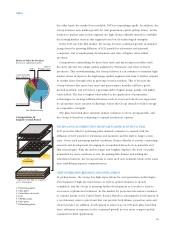
segment increased 41% year-on-year to ¥8.3 billion, centering on next generation
optical products. Total R&D expenditures including development costs for Business
Technologies, Optics, and advanced technologies accounted for 73% of total R&D
expenditures. As the result of focused selection and concentration of management
resources, R&D expenditures in the Photo Imaging segment declined 20% year-on-
year to ¥8.9 billion, while R&D expenditures in the Medical and Graphic Imaging
segment were flat compared with the previous fiscal year at ¥7.6 billion. In addition,
R&D expenditures in the Sensing segment were ¥1.0 billion.
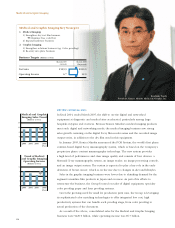
Segment Information
Sales in the Business Technologies segment, reflecting adjustments because of the
merger, were flat year-on-year at ¥564.8 billion, while operating income declined by
¥3.0 billion from the previous fiscal year to ¥55.8 billion. While growth in color MFP
was strong, this growth was not enough to offset a shift to low speed monochrome
MFPs with lower prices, and price declines in LBP due to intensified competition.
On the other hand, Optic segment sales increased ¥6.8 billion for the fiscal year to
¥91.7 billion. The main factor was strong growth in TAC film for LCDs supported by
the diffusion of LCD TVs.
Sales in the Photo Imaging segment, including adjustments for a change in
accounting term due to the merger and changes in the content of this segment,
declined by ¥28.8 billion to ¥268.5 billion. This decline was mainly due to shrinkage
in the color film market, in addition to declining selling prices due to intensified
competition in the digital camera market. As profitability in the film business, which
is the major source of earnings for the segment, deteriorated further, the operating
loss in the segment increased as compared to previous fiscal year.
Medical and Graphic Imaging segment sales in actual terms were slightly higher
for the fiscal year at ¥129.9 billion. While digital input/output equipment for on-site
medical use and related dry film sales were healthy, the rise in total sales for the
segment was limited by a decline in film sales in the Graphic Imaging business.
Operating income for the segment declined slightly from the previous
fiscal year, reflecting a sharp rise in the cost of film materials.
Sensing segment sales, adjusted for changes in segment content as a result of the
merger, were slightly higher than in the previous fiscal year at ¥5.3 billion. Strong
light source color analyzer, spectrophotometer and 3D digitizer equipment sales
supported total sales for the segment. Operating income, again after making slight
adjustments because of the change in segment content, increased slightly from
the previous fiscal year.
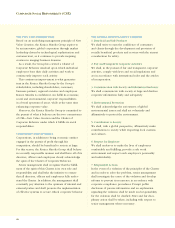
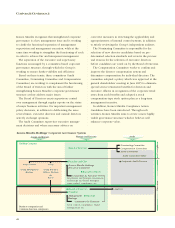
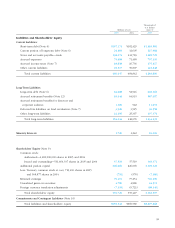
By Segment Billions of yen
Net Sales Operating Income (Loss)
Value Value
2005 2004 change 2005 2004 change
Business Technologies 564.8 625.8 –61.0 55.8 62.9 –7.0
Optics 91.7 85.8 5.9 16.0 15.3 0.7
Photo Imaging 268.5 277.7 –9.2 (8.7) (6.7) -2
Medical and Graphic Imaging 129.9 120.9 9.0 6.7 7.9 –1.2
Sensing 5.3 8.0 –2.7 1.6 1.8 –0.2
Other 7.2 5.4 1.8 (3.9) (7.9) 4.0
Total 1067.4 1123.6 -56.2 67.6 73.2 -5.6
* Includes former Minolta totals for first half FY2004
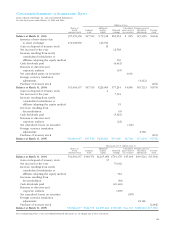
Net Income and
Earnings per Share
(EPS) (¥ billions, %)
0
20
15
10
5
Net Income
Earnings per Share (EPS)
0
80
60
40
20
20042003 2005
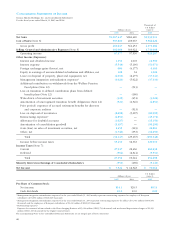
Operating Income
Operating Income Ratio
Operating Income and
Operating Income Ratio
(¥ billions, %)
0
80
0
8
60 6
40 4
20 2
20042003 2005
Business Technologies
Optics
Photo Imaging
Medical and Graphic Imaging
Sensing
Net Sales
(¥ billions)
0
1,200
400
800
20042003 2005