Konica Minolta 2005 Annual Report Download - page 2
Download and view the complete annual report
Please find page 2 of the 2005 Konica Minolta annual report below. You can navigate through the pages in the report by either clicking on the pages listed below, or by using the keyword search tool below to find specific information within the annual report.-
 1
1 -
 2
2 -
 3
3 -
 4
4 -
 5
5 -
 6
6 -
 7
7 -
 8
8 -
 9
9 -
 10
10 -
 11
11 -
 12
12 -
 13
13 -
14
-
15
-
16
-
17
-
18
-
19
-
20
-
21
-
22
-
23
-
24
-
25
-
26
-
27
-
28
-
29
-
30
-
31
-
32
-
33
-
34
-
35
-
36
-
37
-
38
-
39
-
40
-
41
-
42
-
43
-
44
-
45
-
46
-
47
-
48
-
49
-
50
-
51
-
52
-
53
-
54
-
55
-
56
-
57
-
58
-
59
-
60
 |
 |

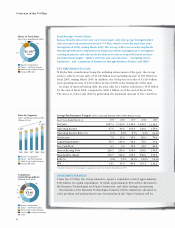
PROFILE
On August 2003, Konica Corporation and Minolta Co., Ltd. integrated their respective managements and
established a new holding company, Konica Minolta Holdings, Inc. The new company represents an
organic union of the revolutionary technologies long accumulated by the two companies, centering on a
comprehensive imaging business—from input to output. Moreover, the new Group is pursuing a
portfolio-oriented management strategy based on five business domains—business technologies, optics,
photo imaging, medical and graphic imaging and sensing. The Konica Minolta Group has annual sales of
over one trillion yen, conducts its business operations in approximately 40 nations worldwide and has
approximately 33,000 employees. Based on an underlying management principle of “New Value Creation”
and driven by its corporate message of “The essentials of imaging”, Konica Minolta aims to provide
inspired creativity in the field of imaging in becoming an innovative, technologically sophisticated,
reliable and market leading global company that is able to enhance corporate value and respond to the
expectations of its stakeholders through corporate creativity.
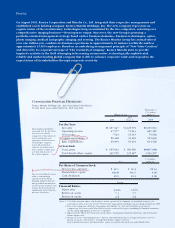
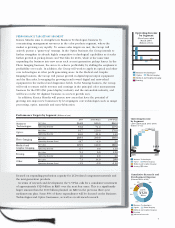
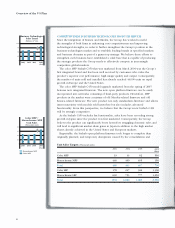
CONSOLIDATED FINANCIAL HIGHLIGHTS
Konica Minolta Holdings, Inc. and Consolidated Subsidiaries
For the fiscal years ended March 31, 2005 and 2004
For the Year:
Net sales
Operating income
Net income
Capital expenditure
R&D expenditures
At Year-End:
Total assets
Total shareholders’ equity
¥1,123,591
73,213
19,343
43,128
63,194
¥ 969,589
335,427
2005
2004
(Note 2)
Millions of yen
Thousands of
U.S. dollars
(Note 1)
2005
Per Share of Common Stock:
Net income—primary
Shareholders’ equity
Cash dividends
¥ 36.4
631.5
10.0
Yen
U.S. dollars
(Note 1)
Financial Ratios:
Equity ratio
Return on assets
Return on equity
34.6%
7.7
5.8
Percent
Notes: 1. U.S. dollar amounts above and elsewhere in this report for the Company are translated from yen, for
convenience only, at the rate of ¥107.39=US$1, the approximate exchange rate prevailing at March 31, 2005.
2. Due to the integration of Konica Corporation and Minolta Co., Ltd. and to facilitate year-on-year
comparisons, fiscal year ended March 2004 business results in this report, excluding the financial statements,
are the simple aggregation of prior two companies.
3. Figures for the March 2003 fiscal year in this report, excluding the financial statements, represent former
Konica figures only.
4. Return on assets = (Operating income + Interest and dividend income) ÷ Average total assets × 100 (%).
Return on equity = Net income ÷ Average shareholders’ equity × 100 (%)
End of period total assets and shareholders’ equity are used for the fiscal year ended March 2004.
Total capital expenditure
increased 31% for the fiscal
year and was mainly
composed of investment in
metal molding for new
equipment in the Business
Technologies segment,
increased production
capacity for polymerized
toner, and for a third LCD-
use TAC film factory in
the Optics segment.
Due to extraordinary losses
such as restructuring
expenses for the Photo
Imaging segment and one-
time goodwill amortization
for the camera business, net
income for the period was
significantly lower than the
previous fiscal year.
¥1,067,447
67,577
7,524
56,448
65,994
¥ 955,542
339,729
$9,939,911
629,267
70,062
525,636
614,526
$8,897,868
3,163,507
¥ 14.1
639.8
10.0
$0.13
5.96
0.09
35.6%
7.2
2.2