Konica Minolta 2005 Annual Report Download - page 16
Download and view the complete annual report
Please find page 16 of the 2005 Konica Minolta annual report below. You can navigate through the pages in the report by either clicking on the pages listed below, or by using the keyword search tool below to find specific information within the annual report.-
 1
1 -
2
-
3
-
4
-
5
-
 6
6 -
 7
7 -
 8
8 -
 9
9 -
 10
10 -
 11
11 -
 12
12 -
 13
13 -
 14
14 -
 15
15 -
 16
16 -
 17
17 -
 18
18 -
 19
19 -
 20
20 -
 21
21 -
 22
22 -
 23
23 -
 24
24 -
 25
25 -
 26
26 -
27
-
28
-
29
-
30
-
31
-
32
-
33
-
34
-
35
-
36
-
37
-
38
-
39
-
40
-
41
-
42
-
43
-
44
-
45
-
46
-
47
-
48
-
49
-
50
-
51
-
52
-
53
-
54
-
55
-
56
-
57
-
58
-
59
-
60
 |
 |

14
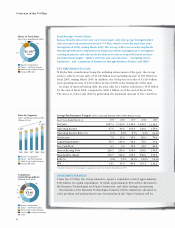
ATAGLANCE
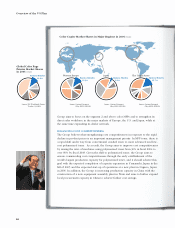
Konica Minolta is positioning its product portfolio through consistent business portfolio management and
a “genre-top” strategy that aims to create globally competitive “best-in-class” products to ensure global
leadership in those fields where it operates. The following is an overview of our major business lines.
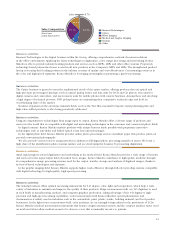
Business
Technologies
Optics
Photo Imaging
Sensing
Main Products:
MFPs, LBPs, facsimile machines,
consumables, software, system
solutions, service.
Main Products:
Optical pickup lenses, lens
units, microcamera units, TAC
film for LCD.
Main Products:
Digital cameras, film,
photographic paper, inkjet
media, ID photo system,
minilabs.
Main Products:
X-ray image processing systems,
X-ray film, contrast media for
diagnostic purposes, digital
color proofing systems, graphic
film.
Main Products:
3-D digitizers; color, light and
temperature measuring
instruments, medical measuring
instruments.
2003 20052004
Net Sales (Billions of Yen)
0
200
400
600
800
594.5 625.8 564.8
2003 20052004
0
20
40
60
80
100 Net Sales (Billions of Yen)
54.0
85.8 91.7
2003 20052004
0
70
140
210
280
350 Net Sales (Billions of Yen)
297.3 277.7 268.5
2003 20052004
0
30
60
90
120
150 Net Sales (Billions of Yen)
117.4 129.9 129.9
2003 20052004
0
2
4
6
8
10 Net Sales (Billions of Yen)
9.3
8.0
5.3
Note: Amounts for the fiscal year to March 2003 are the aggregated total of the two prior companies.
Medical and
Graphic Imaging
Note: New product categorization was adopted from the fiscal year ended March 2005. Under the
previous categorization, March 2005 results were flat with the previous fiscal year.