Konica Minolta 2005 Annual Report Download - page 53
Download and view the complete annual report
Please find page 53 of the 2005 Konica Minolta annual report below. You can navigate through the pages in the report by either clicking on the pages listed below, or by using the keyword search tool below to find specific information within the annual report.-
 1
1 -
2
-
3
-
4
-
5
-
6
-
7
-
8
-
9
-
10
-
11
-
12
-
13
-
14
-
15
-
16
-
17
-
18
-
19
-
20
-
21
-
22
-
23
-
24
-
25
-
26
-
27
-
28
-
29
-
30
-
31
-
32
-
33
-
34
-
35
-
36
-
37
-
38
-
39
-
40
-
41
-
42
-
 43
43 -
 44
44 -
 45
45 -
 46
46 -
 47
47 -
 48
48 -
 49
49 -
 50
50 -
 51
51 -
 52
52 -
 53
53 -
 54
54 -
 55
55 -
 56
56 -
 57
57 -
 58
58 -
 59
59 -
 60
60
 |
 |

51
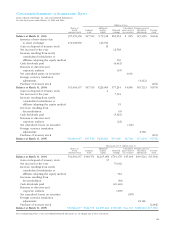
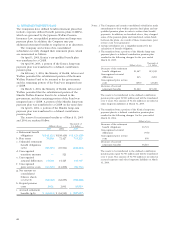
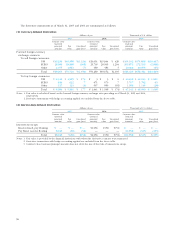
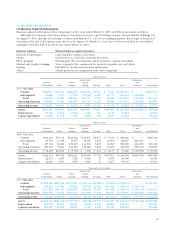
14. SEGMENT INFORMATION
(1) Business Segment Information
Business segment information of the Companies for the years ended March 31, 2005 and 2004 is presented as follows:
Although the Company (the former Konica Corporation) became a new holding company, Konica Minolta Holdings, Inc.,
on August 5, 2003, through an exchange of shares with Minolta Co., Ltd. for accounting purposes, this merger is deemed as
occurring at the end of the interim term, and as such, figures for Minolta Co., Ltd. have not been included in consolidated
earnings for the first half of the fiscal year ended March 31, 2004.
Business segment Related business segment products
Business Technologies: Copy machines, printers and others
Optics: Optical devices, electronic materials and others
Photo Imaging: Photographic film and materials, ink-jet products, cameras and others
Medical and Graphic Imaging: X-ray or graphic film, equipment for medical or graphic use and others
Sensing: Industrial or medical measurement instruments
Other: Others products not categorized in the above segments
Millions of yen
Medical and Elimination
Business Photo Graphic and
Technologies Optics Imaging Imaging Sensing Other Total Corporate Consolidation
2005: Net sales
Outside ¥564,837 ¥91,705 ¥268,471 ¥129,872 ¥5,293 ¥ 7,266 ¥1,067,447 ¥ — ¥1,067,447
Intersegment 29,886 4,079 12,782 19,918 2,425 60,757 129,849 (129,849) —
Total 594,724 95,785 281,253 149,791 7,719 68,024 1,197,297 (129,849) 1,067,447
Operating expenses 538,892 79,783 289,905 143,134 6,125 56,490 1,114,332 (114,462) 999,869
Operating income ¥ 55,832 ¥16,001 ¥ (8,651) ¥ 6,656 ¥1,593 ¥ 11,533 ¥ 82,965 ¥ (15,387) ¥ 67,577
Assets ¥451,381 ¥95,214 ¥169,545 ¥103,963 ¥7,817 ¥443,501 ¥1,271,424 ¥(315,881) ¥ 955,542
Depreciation 27,359 5,672 8,904 4,366 133 6,517 52,953 — 52,953
Capital expenditure 24,258 14,378 7,366 3,695 178 6,571 56,448 — 56,448
Millions of yen
Medical and Elimination
Business Photo Graphic and
Technologies Optics Imaging Imaging Sensing Other Total Corporate Consolidation
2004: Net sales
Outside ¥431,118 ¥76,711 ¥223,962 ¥120,871 ¥2,657 ¥ 5,100 ¥ 860,420 ¥ — ¥860,420
Intersegment 24,594 17,948 15,057 23,461 1,236 43,909 126,207 (126,207) —
Total 455,712 94,660 239,019 144,332 3,893 49,009 986,628 (126,207) 860,420
Operating expenses 409,303 78,491 244,392 136,426 3,092 40,831 912,538 (109,647) 802,890
Operating income ¥ 46,408 ¥16,168 ¥ (5,372) ¥ 7,906 ¥ 801 ¥ 8,177 ¥ 74,090 ¥ (16,559) ¥ 57,530
Assets ¥431,374 ¥86,726 ¥196,027 ¥106,930 ¥7,703 ¥479,901 ¥1,308,664 ¥(339,074) ¥969,589
Depreciation 22,151 4,846 7,229 4,698 72 5,390 44,386 — 44,386
Capital expenditure 11,660 4,976 7,815 4,529 70 6,257 35,307 — 35,307
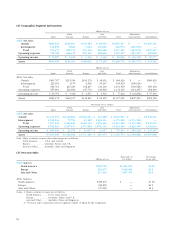
Thousands of U.S. dollars
Medical and Elimination
Business Photo Graphic and
Technologies Optics Imaging Imaging Sensing Other Total Corporate Consolidation
2005: Net sales
Outside $5,259,680 $853,944 $2,499,963 $1,209,349 $49,288 $ 67,660 $ 9,939,911 $ — $9,939,911
Intersegment 278,294 37,983 119,024 185,474 22,581 565,760 1,209,135 (1,209,135) —
Total 5,537,983 891,936 2,618,987 1,394,832 71,878 633,430 11,149,055 (1,209,135) 9,939,911
Operating expenses 5,018,084 742,928 2,699,553 1,332,843 57,035 526,027 10,376,497 (1,065,853) 9,310,634
Operating income $519,899 $148,999 $ (80,557) $ 61,980 $14,834 $ 107,394 $ 772,558 $ (143,281) $ 629,267
Assets $4,203,194 $886,619 $1,578,778 $ 968,088 $72,791 $4,129,817 $11,839,315 $(2,941,438) $8,897,868
Depreciation 254,763 52,817 82,913 40,656 1,238 60,685 493,091 — 493,091
Capital expenditure 225,887 133,886 68,591 34,407 1,658 61,188 525,636 — 525,636