Konica Minolta 2005 Annual Report Download - page 47
Download and view the complete annual report
Please find page 47 of the 2005 Konica Minolta annual report below. You can navigate through the pages in the report by either clicking on the pages listed below, or by using the keyword search tool below to find specific information within the annual report.-
 1
1 -
2
-
3
-
4
-
5
-
6
-
7
-
8
-
9
-
10
-
11
-
12
-
13
-
14
-
15
-
16
-
17
-
18
-
19
-
20
-
21
-
22
-
23
-
24
-
25
-
26
-
27
-
28
-
29
-
30
-
31
-
32
-
33
-
34
-
35
-
36
-
 37
37 -
 38
38 -
 39
39 -
 40
40 -
 41
41 -
 42
42 -
 43
43 -
 44
44 -
 45
45 -
 46
46 -
 47
47 -
 48
48 -
 49
49 -
 50
50 -
 51
51 -
 52
52 -
 53
53 -
 54
54 -
 55
55 -
 56
56 -
 57
57 -
58
-
59
-
60
 |
 |

45
(n) Per Share Data
Net income per share of common stock has been
computed based on the weighted-average number of
shares outstanding during the fiscal year.
Cash dividends per share shown for each fiscal year in
the accompanying consolidated statements are dividends
declared as applicable to the respective fiscal years.
3. U.S. DOLLAR AMOUNTS
Amounts in U.S. dollars are included solely for the
convenience of readers outside Japan. The rate of
¥107.39=US$1, the rate of exchange on March 31, 2005, has
been used in translation. The inclusion of such amounts is
not intended to imply that Japanese yen have been or
could be readily converted, realized or settled in U.S.
dollars at this rate or any other rate.
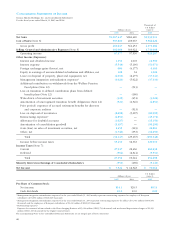
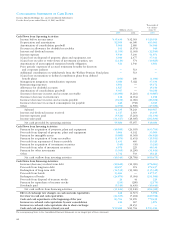
4. CASH AND CASH EQUIVALENTS
Cash and cash equivalents as of March 31 consist of:
Thousands of
Millons of yen U.S. dallars
2005 2004 2005
Cash on hand in banks ¥59,330 ¥83,574 $552,472
Marketable securities 155 130 1,443
Cash and cash equivalents ¥59,485 ¥83,704 $553,916
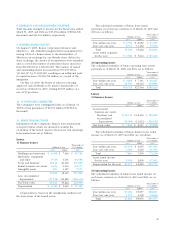
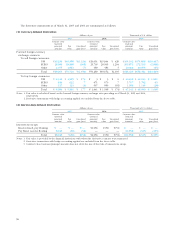
5. SECURITIES
As of March 31, 2005
(1) Other Securities with Quoted Market Values
Millons of yen
Market value
at the
Original consolidated Unrealized
purchase balance gains or
value sheet date losses
Securities for which the amounts in the consolidated
balance sheets exceed the original purchase value
(1) Shares ¥9,908 ¥21,391 ¥11,483
(2) Bonds — — —
(3) Other 19 20 1
Subtotal 9,927 21,412 11,484
Securities for which the amounts in the consolidated
balance sheets do not exceed the original purchase value
(1) Shares 5,560 5,519 (40)
(2) Bonds 116 116 0
(3) Other 70 69 (0)
Subtotal 5,747 5,706 (41)
Total ¥15,675 ¥27,119 ¥11,443
Thousands of U.S. dollars
Total $145,963 $252,528 $106,556
(2) Other Securities Sold during the Fiscal Year under
Review
Millons of yen
Sale value Total profit Total loss
Other securities ¥5,128 ¥2,461 ¥3
Thousands of U.S. dollars
Other securities $47,751 $22,916 $28
(3) Composition and Amounts on the Consolidated
Balance Sheets of Other Securities without Market
Quotes
Amounts on consolidated balance sheets
Thousands of
Millons of yen U.S. dallars
Unlisted stocks ¥1,545 $14,387
Other ¥155 $1,443
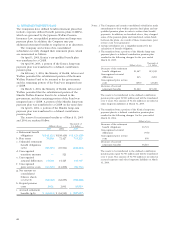
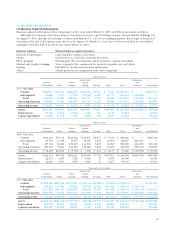
As of March 31, 2004
(1) Other Securities with Quoted Market Values
Millons of yen
Market value
at the
Original consolidated Unrealized
purchase balance gains or
value sheet date losses
Securities for which the amounts in the consolidated
balance sheets exceed the original purchase value
(1) Shares ¥15,679 ¥25,165 ¥9,485
(2) Other 22 26 4
Subtotal 15,702 25,192 9,489
Securities for which the amounts in the consolidated
balance sheets do not exceed the original purchase value
(1) Shares 5,685 5,007 (678)
(2) Other 186 181 (4)
Subtotal 5,872 5,189 (683)
Total ¥21,574 ¥30,381 ¥8,806
(2) Other Securities Sold during the Fiscal Year under
Review
Millons of yen
Sale value Total profit Total loss
Other securities ¥501 ¥228 ¥461
(3) Composition and Amounts on the Consolidated
Balance Sheets of Other Securities without Market
Quotes
Amounts on consolidated balance sheets
Millons of yen
Unlisted stocks ¥1,443
Unlisted foreign bonds 5
Other ¥130