Konica Minolta 2005 Annual Report Download - page 48
Download and view the complete annual report
Please find page 48 of the 2005 Konica Minolta annual report below. You can navigate through the pages in the report by either clicking on the pages listed below, or by using the keyword search tool below to find specific information within the annual report.-
 1
1 -
2
-
3
-
4
-
5
-
6
-
7
-
8
-
9
-
10
-
11
-
12
-
13
-
14
-
15
-
16
-
17
-
18
-
19
-
20
-
21
-
22
-
23
-
24
-
25
-
26
-
27
-
28
-
29
-
30
-
31
-
32
-
33
-
34
-
35
-
36
-
37
-
 38
38 -
 39
39 -
 40
40 -
 41
41 -
 42
42 -
 43
43 -
 44
44 -
 45
45 -
 46
46 -
 47
47 -
 48
48 -
 49
49 -
 50
50 -
 51
51 -
 52
52 -
 53
53 -
 54
54 -
 55
55 -
 56
56 -
 57
57 -
 58
58 -
59
-
60
 |
 |

46
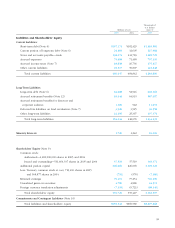
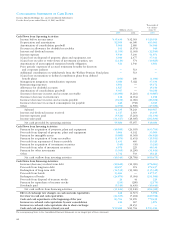
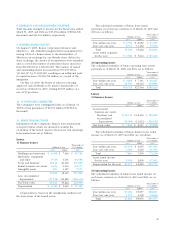
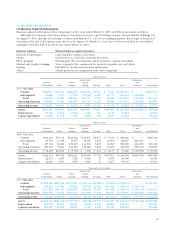
6. SHORT-TERM & LONG-TERM DEBT WITH BANKS
Short-term and long-term debt as of March 31, 2005 and
2004 are summarized as follows:
Thousands of
Millions of yen U.S. dollars
2005 2004 2005
(Interest rate)
Short-term debt ¥157,174 1.87 ¥182,429 $1,463,581
Current portion of
long-term debt 7,261 2.41 14,251 67,613
Long-term debt 54,604 1.09 32,778 508,464
Total ¥219,040 ¥229,459 $2,039,668
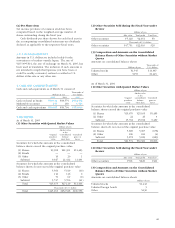
The repayment schedule of long-term debt from 2007
through 2010 is as follows:
Thousands of
Years ending March 31 Millions of yen U.S. dollars
2007 ¥ 8,086 $ 75,296
2008 16,895 157,324
2009 6,495 60,480
2010 and beyond 23,128 215,365
Bonds
Bonds as of March 31, 2005 and 2004 are summarized as
follows:
Thousands of
Millions of yen U.S. dollars
2005 2004 2005
Bonds ¥27,305 ¥38,492 $254,260
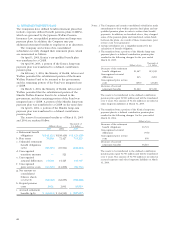
The annual maturities of bonds as of March 31, 2005
are as follows:
Thousands of
Years ending March 31 Millions of yen U.S. dollars
2006 ¥17,221 $160,359
2007 5,054 47,062
2008 30 279
2009 5,000 46,559
Assets pledged as collateral for short-term debt, long-
term debt and guarantees as of March 31, 2005 and 2004
are as follows:
Thousands of
Millions of yen U.S. dollars
2005 2004 2005
Property, plant and
equipment ¥887 ¥3,092 $8,260
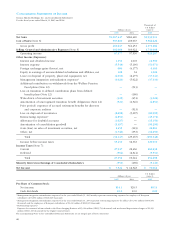
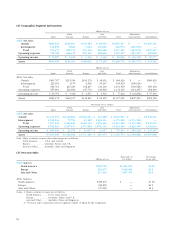
7. INCOME TAXES
At March 31, 2005 and 2004, significant components of
deferred tax assets and liabilities were as follows:
Thousands of
Millions of yen U.S. dollars
2005 2004 2005
Gross deferred tax assets:
Excess of reserve for
retirement benefits
over deductible limit ¥31,309 ¥ 33,194 $291,545
Net loss carried forward 17,112 19,174 159,344
Elimination of unrealized
intercompany profits 14,651 14,185 136,428
Write-down of assets 7,119 5,587 66,291
Excess of accrued bonuses
over deductible limit 5,993 6,101 55,806
Excess of allowance for
doubtful accounts over
deductible limit 1,693 1,608 15,765
Excess of depreciation
and amortization over
deductible limit 1,497 3,712 13,940
Other 13,842 11,660 128,895
Subtotal 93,220 95,225 868,051
Valuation allowance (18,264) (19,483) (170,072)
Deferred tax assets total 74,955 75,742 697,970
Gross deferred tax liabilities:
Unrealized gains on securities (4,299) (4,991) (40,032)
Gains on securities con-
tributed to employees’
retirement benefit trust (3,353) (3,442) (31,223)
Special tax-purpose reserve
for condensed booking of
fixed assets (1,440) (3,296) (13,409)
Other (1,870) (1,155) (17,423)
Deferred tax liabilities total (10,964) (12,886) (102,095)
Net deferred tax assets ¥63,991 ¥ 62,855 $595,875
Deferred tax liabilities related
to revaluation of land ¥(3,926) ¥ (3,925) $(36,558)
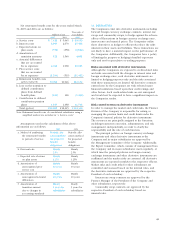
Deferred tax assets relating to net losses carried forward
are recorded because the Japanese accounting standard
requires that the benefit be estimated and recorded as an
asset, with deduction of a valuation allowance if it is
expected that some portion or all of the deferred tax assets
will not be realized.
At March 31, 2005 and 2004, the reconciliation of the
statutory income tax rate to the effective income tax rate is
as follows:
2005 2004
Statutory income tax rate 40.7% 42.1%
Valuation allowance (3.5) 15.9
Tax deduction (8.6) (6.1)
Tax rate change —2.4
Amortization of
consolidation goodwill 12.9 3.7
Effect of the introduction of
a consolidated tax return system 28.6 —
Other, net 7.1 2.6
Effective income tax rate 77.2% 60.6%