Kia 2010 Annual Report Download - page 56
Download and view the complete annual report
Please find page 56 of the 2010 Kia annual report below. You can navigate through the pages in the report by either clicking on the pages listed below, or by using the keyword search tool below to find specific information within the annual report.-
 1
1 -
2
-
3
-
4
-
5
-
6
-
7
-
8
-
9
-
10
-
11
-
12
-
13
-
14
-
15
-
16
-
17
-
18
-
19
-
20
-
21
-
22
-
23
-
24
-
25
-
26
-
27
-
28
-
29
-
30
-
31
-
32
-
33
-
34
-
35
-
36
-
37
-
38
-
39
-
40
-
41
-
42
-
43
-
44
-
45
-
 46
46 -
 47
47 -
 48
48 -
 49
49 -
 50
50 -
 51
51 -
 52
52 -
 53
53 -
 54
54 -
 55
55 -
 56
56 -
 57
57 -
 58
58 -
 59
59 -
 60
60 -
 61
61 -
 62
62 -
 63
63 -
 64
64
 |
 |
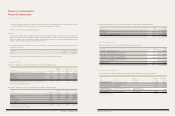
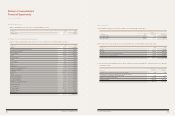
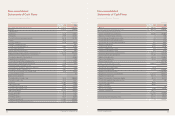
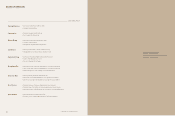
Non-consolidated
Statements of Financial Position
In millions of won, except share data
As of December 31, 2010 and 2009
Note 2010 2009
ASSETS
Cash and cash equivalents 20 ₩ 975,506 1,442,031
Short-term financial instruments 1,280,000 470,000
Accounts and notes receivable - trade, less discount
on present value of ₩2,237 in 2010 and
₩3,452 in 2009 and allowance for doubtful
accounts of ₩98,440 in 2010 and ₩100,684 in 2009 4, 9, 20 1,072,228 1,144,297
Accounts and notes receivable - other, less
allowance for doubtful accounts of
₩32,697 in 2010 and ₩33,981 in 2009 9, 20 128,711 201,647
Inventories 5, 10, 30 945,112 799,141
Current deferred tax assets, net 29 74,831 157,839
Other current assets 6, 7, 23 107,774 93,748
Total current assets 4,584,162 4,308,703
Long-term investment securities 7, 13 17,270 17,680
Equity method accounted investments 8 6,184,006 4,929,976
Property, plant and equipment, net 9, 10, 13, 18 6,402,104 6,294,001
Intangible assets 11, 30 1,216,192 1,074,110
Other non-current assets 3, 9, 12, 20 221,677 317,126
Total non-current assets 14,041,249 12,632,893
Total assets ₩ 18,625,411 16,941,596
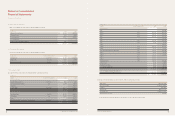
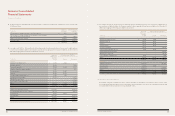
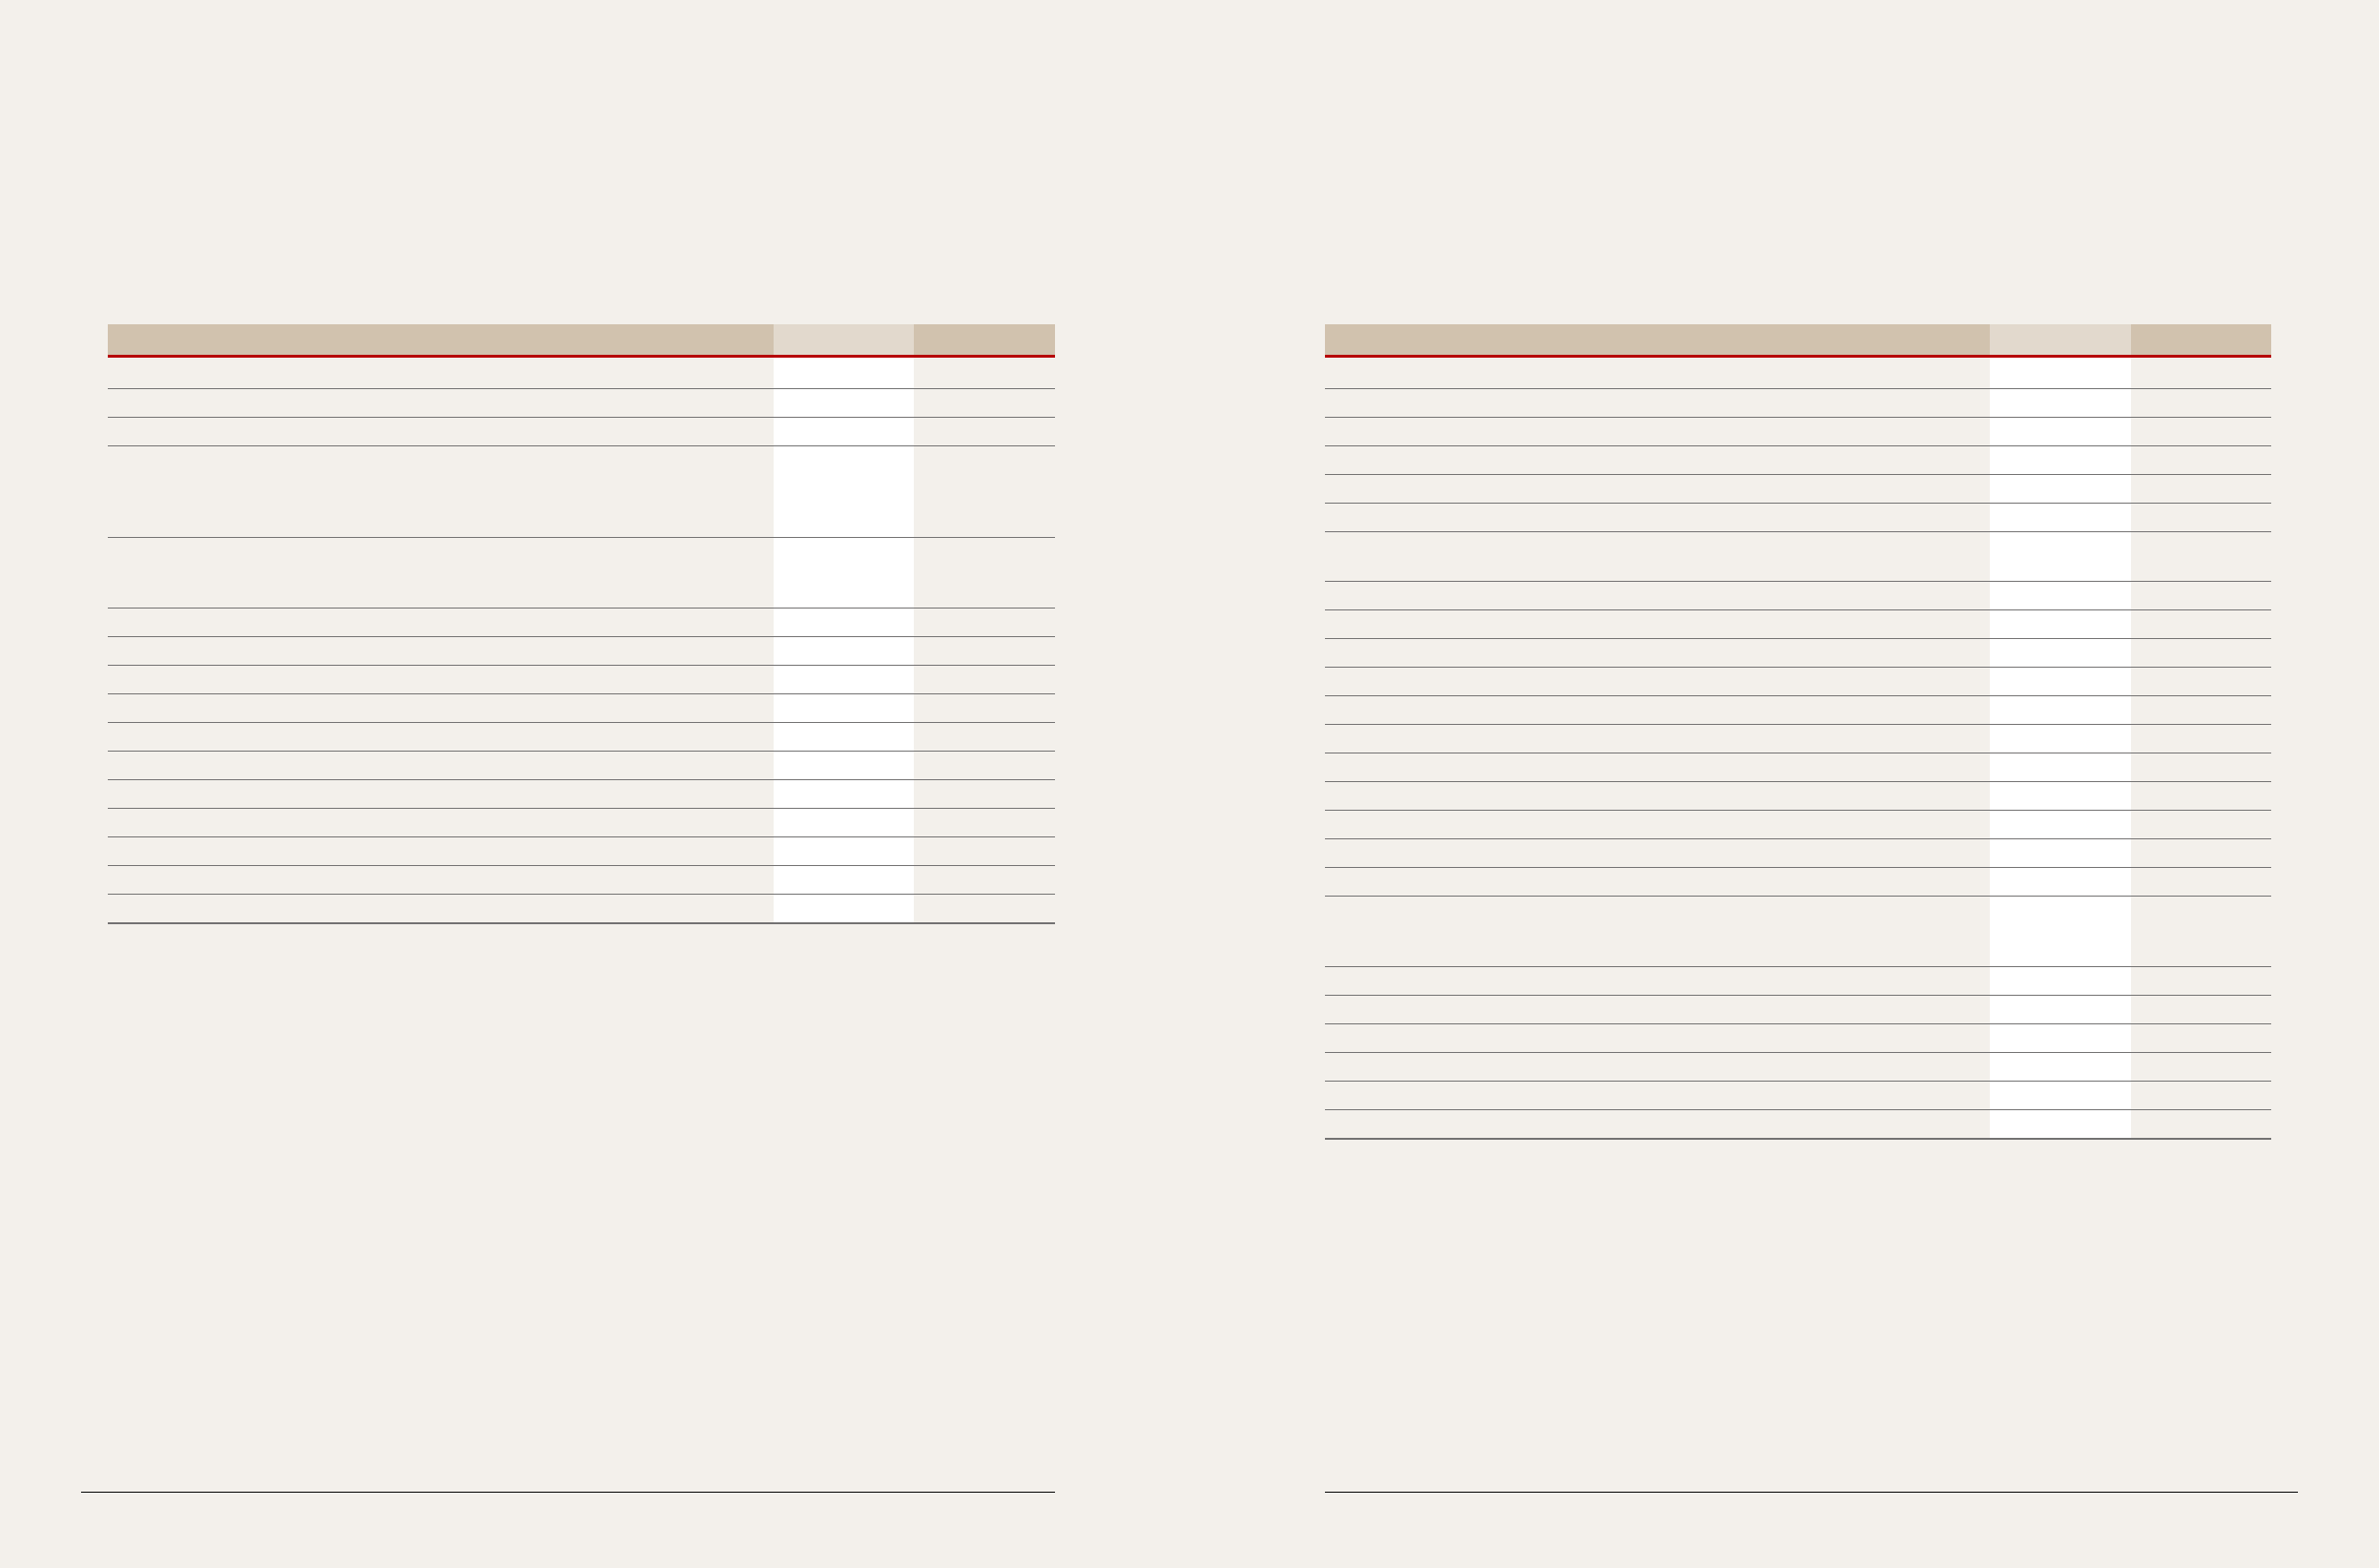
Non-consolidated
Statements of Financial Position
In millions of won, except share data
As of December 31, 2010 and 2009
Note 2010 2009
LIABILITIES
Accounts and notes payable - trade 9, 20 ₩ 3,106,408 2,404,887
Short-term borrowings 15, 20 110,888 79,453
Accounts and notes payable - other 9, 20 985,676 759,941
Income taxes payable 29 178,256 21,511
Provision for warranties - current 21 242,908 227,515
Current portion of long-term debt, less discount
of ₩467 in 2010 and ₩510 in 2009 13, 16, 20, 22 1,277,653 1,655,222
Current portion of capital lease obligation 18 - 80,215
Other current liabilities 9, 14, 20, 23 386,713 616,882
Total current liabilities 6,288,502 5,845,626
Long-term debt, less discount of ₩4,703 in 2010 and ₩7,726 in 2009 13, 16, 20, 22 1,495,330 2,745,592
Provision for warranties 21 451,843 371,615
Non-current deferred tax liabilities, net 29 429,269 160,189
Provision for retirement and severance benefits, net 19 187,575 327,881
Other non-current liabilities 17 111,683 114,298
Total non-current liabilities 2,675,700 3,719,575
Total liabilities 8,964,202 9,565,201
STOCKHOLDERS’ EQUITY
Common stock of ₩5,000 par value Authorized - 820,000,000 shares
Issued - 397,854,423 shares in 2010 and 388,371,048 shares in 2009
Outstanding - 397,476,307 shares in 2010 and 387,995,332 shares in 2009 24 2,101,772 2,054,355
Capital surplus 25 1,808,009 1,761,403
Capital adjustments 24, 26 (14,515) (2,249)
Accumulated other comprehensive income 23, 29, 33 1,282,095 1,197,566
Retained earnings 27 4,483,848 2,365,320
Total stockholders’ equity 9,661,209 7,376,395
Total liabilities and equity ₩ 18,625,411 16,941,596
112 COMPONENTS OF SUSTAINABLE GROWTH 113
KIA MOTORS ANNUAL REPORT 2010