Kia 2010 Annual Report Download - page 27
Download and view the complete annual report
Please find page 27 of the 2010 Kia annual report below. You can navigate through the pages in the report by either clicking on the pages listed below, or by using the keyword search tool below to find specific information within the annual report.-
 1
1 -
2
-
3
-
4
-
5
-
6
-
7
-
8
-
9
-
10
-
11
-
12
-
13
-
14
-
15
-
16
-
 17
17 -
 18
18 -
 19
19 -
 20
20 -
 21
21 -
 22
22 -
 23
23 -
 24
24 -
 25
25 -
 26
26 -
 27
27 -
 28
28 -
 29
29 -
 30
30 -
 31
31 -
 32
32 -
 33
33 -
 34
34 -
 35
35 -
 36
36 -
 37
37 -
38
-
39
-
40
-
41
-
42
-
43
-
44
-
45
-
46
-
47
-
48
-
49
-
50
-
51
-
52
-
53
-
54
-
55
-
56
-
57
-
58
-
59
-
60
-
61
-
62
-
63
-
64
 |
 |

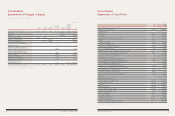
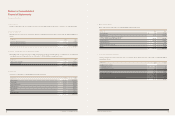
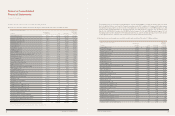
Consolidated
Statements of Income
In millions of won, except earnings per share
For the years ended December 31, 2010 and 2009
Note 2010 2009
Sales 9, 10, 34 ₩ 42,290,340 29,257,392
Cost of sales 9, 10 33,097,981 22,875,853
GROSS PROFIT 9,192,359 6,381,539
Selling, general and administrative expenses 27 6,356,249 5,186,333
OPERATING INCOME 2,836,110 1,195,206
Interest income 125,829 105,209
Interest expense (300,157) (560,239)
Foreign currency translation gain, net 20 32,706 6,190
Foreign currency transaction gain (loss), net 56,116 (30,686)
Loss on scrapped inventories (4,612) (6,551)
Dividend income 91 1,007
Equity in earnings of equity method accounted investees, net 8 838,125 723,542
Loss on sale of accounts and notes receivable - trade (32,549) (87,557)
Impairment loss on investments (14) (689)
Gain (loss) on disposition of investments, net (77) 58,290
Gain (loss) on valuation of derivatives, net 23 6,651 (2,973)
Loss on sale of property, plant and equipment, net 11 (35,109) (22,967)
Loss on impairment of property, plant and equipment, net 11 (8,681) (28,760)
Loss on impairment of intangible assets, net 12 - (34,644)
Other, net (3,819) (93,664)
OTHER INCOME 674,500 25,508
INCOME BEFORE INCOME TAXES AND MINORITY INTERESTS 3,510,610 1,220,714
Income taxes 28 668,411 200,082
CONSOLIDATED NET INCOME ₩ 2,842,199 1,020,632
Net income of controlling interest 2,640,659 979,417
Net income of minority interest 201,540 41,215
Basic earnings per share 30 ₩ 6,738 2,667
Diluted earnings per share 30 ₩ 6,546 2,517
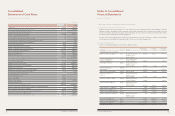
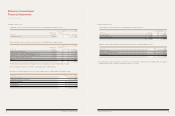
Consolidated
Statements of Changes in Equity
In millions of won
For the years ended December 31, 2010 and 2009
Minority
Accumulated interest in
other equity of
Capital Capital Capital comprehensive Retained consolidated
stock surplus adjustments income earnings subsidiaries Total
BALANCE AT JANUARY 1, 2009 ₩ 1,848,652 1,602,396 (2,427) 1,043,843 894,461 432,659 5,819,584
Net income - - - - 979,417 41,215 1,020,632
Exercise of stock warrants 205,703 56,138 - - - - 261,841
Proceeds from treasury stock - 682 628 - - - 1,310
Exercise of stock options - - (450) - - - (450)
Change in capital adjustments-gain of
equity method accounted investments - - - (314,590) - - (314,590)
Change in capital adjustments-loss of
equity method accounted investments - - - 428,804 - - 428,804
Change in fair value of available-for-sale
securities, net of tax - - - (27) - - (27)
Revaluation surplus (520) (520)
Valuation gains in derivatives - - - 11,029 - - 11,029
Valuation gains in non-derivatives - - - 40,734 - - 40,734
Foreign operation currency
translation differences, net - - - (48,145) - 83,892 35,747
BALANCE AT DECEMBER 31, 2009 ₩ 2,054,355 1,659,216 (2,249) 1,161,128 1,873,878 557,766 7,304,094
See accompanying notes to consolidated financial statements.
See accompanying notes to consolidated financial statements.
54 COMPONENTS OF SUSTAINABLE GROWTH 55
KIA MOTORS ANNUAL REPORT 2010