Kia 2010 Annual Report Download - page 53
Download and view the complete annual report
Please find page 53 of the 2010 Kia annual report below. You can navigate through the pages in the report by either clicking on the pages listed below, or by using the keyword search tool below to find specific information within the annual report.-
 1
1 -
2
-
3
-
4
-
5
-
6
-
7
-
8
-
9
-
10
-
11
-
12
-
13
-
14
-
15
-
16
-
17
-
18
-
19
-
20
-
21
-
22
-
23
-
24
-
25
-
26
-
27
-
28
-
29
-
30
-
31
-
32
-
33
-
34
-
35
-
36
-
37
-
38
-
39
-
40
-
41
-
42
-
 43
43 -
 44
44 -
 45
45 -
 46
46 -
 47
47 -
 48
48 -
 49
49 -
 50
50 -
 51
51 -
 52
52 -
 53
53 -
 54
54 -
 55
55 -
 56
56 -
 57
57 -
 58
58 -
 59
59 -
 60
60 -
 61
61 -
 62
62 -
 63
63 -
64
 |
 |
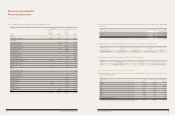
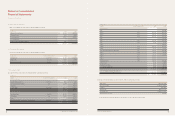
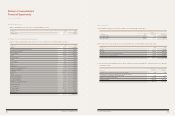
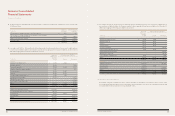
30. Earnings per Share
Earnings per share of common stock for the years ended December 31, 2010 and 2009 are calculated as follows:
(a) Basic earnings per share are calculated by dividing net income by the weighted-average number of shares of common stock
outstanding.
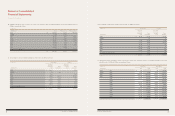
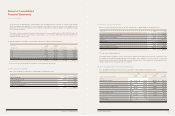
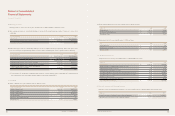
31. Dividends
(a) Details of dividends for the years ended December 31, 2010 is as follows:
(b) Details of dividend payout ratio for the year ended December 31, 2010 is as follows:
(c) Dividend yield ratio for the year ended December 31, 2010 is as follows:
32. Comprehensive Income
Comprehensive income for the years ended December 31, 2010 and 2009 are as follows:
(b) Diluted earnings per share are calculated by dividing net income, as adjusted assuming all potentially dilutive stock options have
been exercised, by the weighted-average number of common shares outstanding and common equivalent shares outstanding.
(*) For the purpose of calculating the weighted-average number of common equivalent shares outstanding, the Company assumed
that ordinary shares were issued upon substitute payment of bond with warrant(“BW”).
In won, except number of shares 2010 2009
NET INCOME ₩ 2,640,658,994,121 979,417,199,804
Weighted-average number of common shares outstanding 391,928,327 367,279,904
EARNINGS PER SHARE ₩ 6,738 2,667
In millions of won, except share data 2010 2009
Number of shares issued 397,854,423 388,371,048
Number of treasury stock (378,116) (375,716)
Number of dividend shares 397,476,307 387,995,332
Par value per share ₩ 5,000 5,000
Dividends as a percentage of par value 10% 5%
Dividend amount ₩ 198,738 96,999
In millions of won 2010 2009
Dividend amount ₩ 198,738 96,999
Net income of controlling interest ₩ 2,640,659 979,417
Dividend payout ratio 7.53% 9.9%
In won 2010 2009
Dividend per share ₩ 500 250
Market price as of year end ₩ 50,600 20,050
Dividend yield ratio 0.99% 1.25%
In millions of won 2010 2009
NET INCOME ₩ 2,842,199 1,020,632
Change in fair value of available-for-sale securities, net of tax 27 (27)
Valuation gains in derivatives, net of tax 1,758 11,029
Valuation gains in non-derivatives, net of tax 52,465 40,734
Unrealized holding gain on equity method accounted investments, net of tax 80,898 (314,590)
Unrealized holding loss on equity method accounted investments, net of tax 5,462 428,804
Revaluation surplus, net of tax (10,861) (520)
Foreign operation currency translation differences (55,602) 35,747
NET COMPREHENSIVE INCOME ₩ 2,916,346 1,221,809
In won, except number of shares 2010 2009
NET INCOME ₩ 2,640,658,994,121 979,417,199,804
BW interest expense x (1 – marginal tax rate)(*) 7,253,763,336 8,959,914,099
2,647,912,757,457 988,277,113,903
Weighted-average number of common shares outstanding 391,928,327 367,279,904
Weighted-average number of common equivalent shares outstanding(*) 12,610,829 25,405,794
Weighted-average number of common shares outstanding and
common equivalent shares outstanding 404,539,156 392,685,698
DILUTED EARNINGS PER SHARE ₩ 6,546 2,517
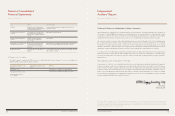
Notes to Consolidated
Financial Statements
December 31, 2010 and 2009
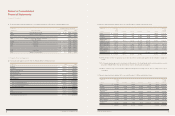
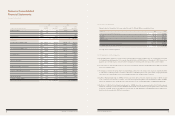
33. Non-cash Investing and Financing Activities
Significant non-cash investing and financing activities for the years ended December 31, 2010 and 2009 are summarized as follows:
In millions of won 2010 2009
Construction-in-progress transferred to property, plant and equipment ₩ 693,983 1,051,524
Capital lease assets transferred to property, plant and equipment 178,113 -
106 COMPONENTS OF SUSTAINABLE GROWTH 107
KIA MOTORS ANNUAL REPORT 2010