Kia 2010 Annual Report Download - page 29
Download and view the complete annual report
Please find page 29 of the 2010 Kia annual report below. You can navigate through the pages in the report by either clicking on the pages listed below, or by using the keyword search tool below to find specific information within the annual report.-
 1
1 -
2
-
3
-
4
-
5
-
6
-
7
-
8
-
9
-
10
-
11
-
12
-
13
-
14
-
15
-
16
-
17
-
18
-
 19
19 -
 20
20 -
 21
21 -
 22
22 -
 23
23 -
 24
24 -
 25
25 -
 26
26 -
 27
27 -
 28
28 -
 29
29 -
 30
30 -
 31
31 -
 32
32 -
 33
33 -
 34
34 -
 35
35 -
 36
36 -
 37
37 -
 38
38 -
 39
39 -
40
-
41
-
42
-
43
-
44
-
45
-
46
-
47
-
48
-
49
-
50
-
51
-
52
-
53
-
54
-
55
-
56
-
57
-
58
-
59
-
60
-
61
-
62
-
63
-
64
 |
 |

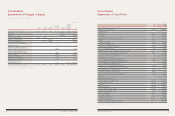
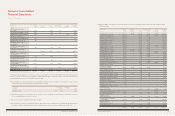
In millions of won
2010 2009
Other, net ₩ (216,612) (54,773)
NET CASH PROVIDED BY OPERATING ACTIVITIES 4,395,585 4,306,926
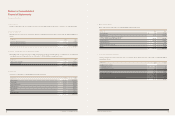
CASH FLOWS FROM INVESTING ACTIVITIES
Increase of short-term financial instruments (870,489) (356,372)
Increase in long-term financial instruments 301 -
Proceeds from sale of long-term investment securities 911 3,514
Proceeds from sale of equity method accounted investment securities - 1,369
Proceeds from sale of property, plant and equipment 24,349 17,147
Receipt of government subsidy 46,067 14,136
Purchase of long-term investment securities (1,150) (2,884)
Purchase of equity method accounted investments (175,731) (25,377)
Purchase of property, plant and equipment (1,228,718) (993,954)
Additions to intangible assets (396,826) (370,610)
Change in other assets, net (16,561) (26,788)
NET CASH USED IN INVESTING ACTIVITIES (2,617,847) (1,739,819)
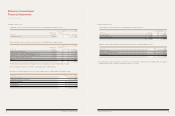
CASH FLOWS FROM FINANCING ACTIVITIES
Proceeds from long-term debt 373,440 2,519,774
Repayment of short-term borrowings (775,294) (2,998,973)
Repayment of current portion of long-term debt (1,435,357) (878,337)
Repayment of long-term debt (510,531) (636,426)
Repayment of current portion of sales-leaseback obligation (80,215) (83,751)
Proceeds from repayments of deposits received, net 4,113 31,175
Proceeds from exercise of stock options - 861
Proceeds from treasury stock 150,055 -
Payment of dividends (96,992) -
Exercise of stock warrants 64,976 249,370
Acquisition of treasury stock (162,321) -
NET CASH USED IN FINANCING ACTIVITIES (2,468,126) (1,796,307)
Increase in cash and cash equivalents due to change in consolidated subsidiaries - 75,097
Cash flows due to foreign currency translation 81,912 186,613
NET INCREASE (DECREASE) IN CASH AND CASH EQUIVALENTS (608,476) 1,032,510
Cash and cash equivalents at beginning of year 2,301,141 1,268,631
CASH AND CASH EQUIVALENTS AT END OF YEAR ₩ 1,692,665 2,301,141
Consolidated
Statements of Cash Flows
For the years ended December 31, 2010 and 2009
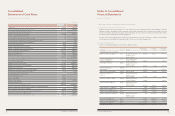
1. General Description of the Parent Company and Subsidiaries
(a) Organization and Description of the Company
Kia Motors Corporation (the “Parent Company”), one of the leading motor vehicle manufacturers in Korea, was established on December
1944 under the laws of the Republic of Korea to manufacture and sell a range of passenger cars, recreational vehicles and other commercial
vehicles in the domestic and international markets. The Parent Company owns and operates three principal automobile production bases:
the Sohari factory, the Hwasung factory and the Kwangju factory.
The shares of the Parent Company have been listed on the Korea Exchange since 1973. As of December 31, 2010, the Parent Company’s
largest shareholder is Hyundai Motor Company, which holds 33.75 percent of the Parent Company’s stock.
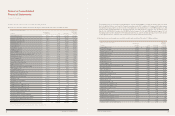
(b) Consolidated Subsidiaries
(i) Details of consolidated subsidiaries as of December 31, 2010 are as follows:
Notes to Consolidated
Financial Statements
December 31, 2010 and 2009
Net asset value Number of Percentage of
Subsidiary Location Business (in millions) shares ownership
<Subsidiaries included in consolidation>
Kia Motors America, Inc. (KMA) U.S.A. Exclusive importer and ₩ 250,829 1,000,000 100.00%
distributor of motor
vehicles and parts
Kia Motors Manufacturing U.S.A. Manufacturing and sale
Georgia, Inc.(KMMG)(*1) of vehicles and parts 532,422 - 50.00%
Kia Canada, Inc. (KCI)(*2) Canada Exclusive importer and
distributor of motor
vehicles and parts (49,991) 6,298 100.00%
Kia Motors Deutschland Germany “
GmbH (KMD) 104,108 - 100.00%
Kia Motors Europe GmbH (KME) Germany Holding company 809,260 260,573 100.00%
Kia Motors Polska Sp.z.o.o. Poland Exclusive importer and
(KMP)(*3) distributor of motor
vehicles and parts (10,944) 15,637 99.60%
Kia Motors Slovakia s.r.o. (KMS) Slovakia Manufacturing and sale
of vehicles and parts 776,905 - 100.00%
Kia Motors Belgium (KMB) (*4) Belgium Exclusive importer and
distributor of motor
vehicles and parts (45,911) 1,000,000 100.00%
Kia Motors Czech s.r.o. (KMCZ)(*4) Czech “ 13,926 106,870,000 100.00%
Kia Motors (UK) Ltd. (KMUK) (*4) U.K. “ (30,448) 17,000,000 100.00%
Kia Motors Austria GmbH (KMAS)(*4) Austria “ (22,739) 2,107,512 100.00%
Kia Motors Hungary K.f.t. (KMH)(*4) Hungary Exclusive importer and 903 30,000,000 100.00%
distributor of motor
vehicles and parts
Kia Motors Iberia (KMIB) (*4) Spain “ (177,047) 31,600,000 100.00%
Kia Motors Sweden AB (KMSW)(*4) Sweden “ 20,263 4,400,000 100.00%
Kia Motors France (KMF)(*4) France “ (91,412) 5,000,000 100.00%
58 COMPONENTS OF SUSTAINABLE GROWTH 59
KIA MOTORS ANNUAL REPORT 2010