Kia 2010 Annual Report Download - page 5
Download and view the complete annual report
Please find page 5 of the 2010 Kia annual report below. You can navigate through the pages in the report by either clicking on the pages listed below, or by using the keyword search tool below to find specific information within the annual report.-
 1
1 -
 2
2 -
 3
3 -
 4
4 -
 5
5 -
 6
6 -
 7
7 -
 8
8 -
 9
9 -
 10
10 -
 11
11 -
 12
12 -
 13
13 -
 14
14 -
 15
15 -
 16
16 -
17
-
18
-
19
-
20
-
21
-
22
-
23
-
24
-
25
-
26
-
27
-
28
-
29
-
30
-
31
-
32
-
33
-
34
-
35
-
36
-
37
-
38
-
39
-
40
-
41
-
42
-
43
-
44
-
45
-
46
-
47
-
48
-
49
-
50
-
51
-
52
-
53
-
54
-
55
-
56
-
57
-
58
-
59
-
60
-
61
-
62
-
63
-
64
 |
 |
2010 2009 2008 2007 2006
SALES VOLUME (Units) 2,129,948 1,533,606 1,399,236 1,359,956 1,258,851
Korea 1,400,293 1,142,038 1,056,400 1,114,451 1,140,734
Overseas 729,655 391,568 342,836 245,505 118,117
SUMMARIZED BALANCE SHEET
(KRW in millions)
Total Assets 27,593,159 25,962,876 25,583,550 19,461,002 17,342,939
Cash Items 3,057,223 2,791,688 1,406,211 1,151,957 1,017,512
Current Assets 11,463,545 11,208,990 11,709,967 8,369,696 7,310,750
Total Liabilities 17,387,961 18,658,782 19,763,966 14,918,798 12,678,920
Short-term Debt 1,948,739 3,752,210 6,751,183 5,597,760 4,235,584
Current Liabilities 12,355,273 12,910,209 13,692,654 10,420,754 9,366,880
Long-term Debt 4,472,894 6,192,950 5,586,300 3,900,995 2,688,615
Total Stockholders’ Equity 10,205,198 7,304,094 5,819,584 4,542,204 4,664,019
Total Liabilities & Stockholders’ Equity 27,593,159 25,962,876 25,583,550 19,461,002 17,342,939
SUMMARIZED INCOME STATEMENT
(KRW in millions)
Sales Revenue 42,290,340 29,445,206 22,217,661 20,311,996 19,814,690
Gross Profit 9,192,359 6,676,148 4,657,480 3,817,963 3,316,509
Operating Profit 2,836,110 1,195,206 664 (57,923) (365,229)
Ordinary Profit 3,510,610 1,220,714 (297,044) (99,854) (263,897)
Net Income 2,640,659 979,417 (90,136) (151,469) (290,760)
Total Debt/Equity 62.9% 136.2% 212.0% 209.1% 148.5%
Net Debt/Equity 33.0% 97.9% 187.8% 183.8% 126.6%
SUMMARIZED CASH FLOWS
(KRW in millions)
Cash Flows from Operating Activities 4,395,585 4,306,926 (408,449) (967,486) (629,791)
Cash Flows from Investing Activities (2,614,325) (1,739,819) (1,958,906) (1,338,083) (1,463,028)
Cash Flows from Financing Activities (2,468,126) (1,796,307) 2,494,448 2,435,066 1,763,337
Cash and Cash Equivalents, Beginning of Year 2,297,619 1,268,631 1,036,288 884,702 1,233,298
Net Increase (Decrease) (604,954) 1,032,510 232,343 151,586 (348,596)
Cash and Cash Equivalents, End of Year 1,692,665 2,301,141 1,268,631 1,036,288 884,702
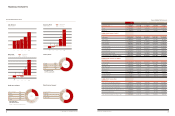
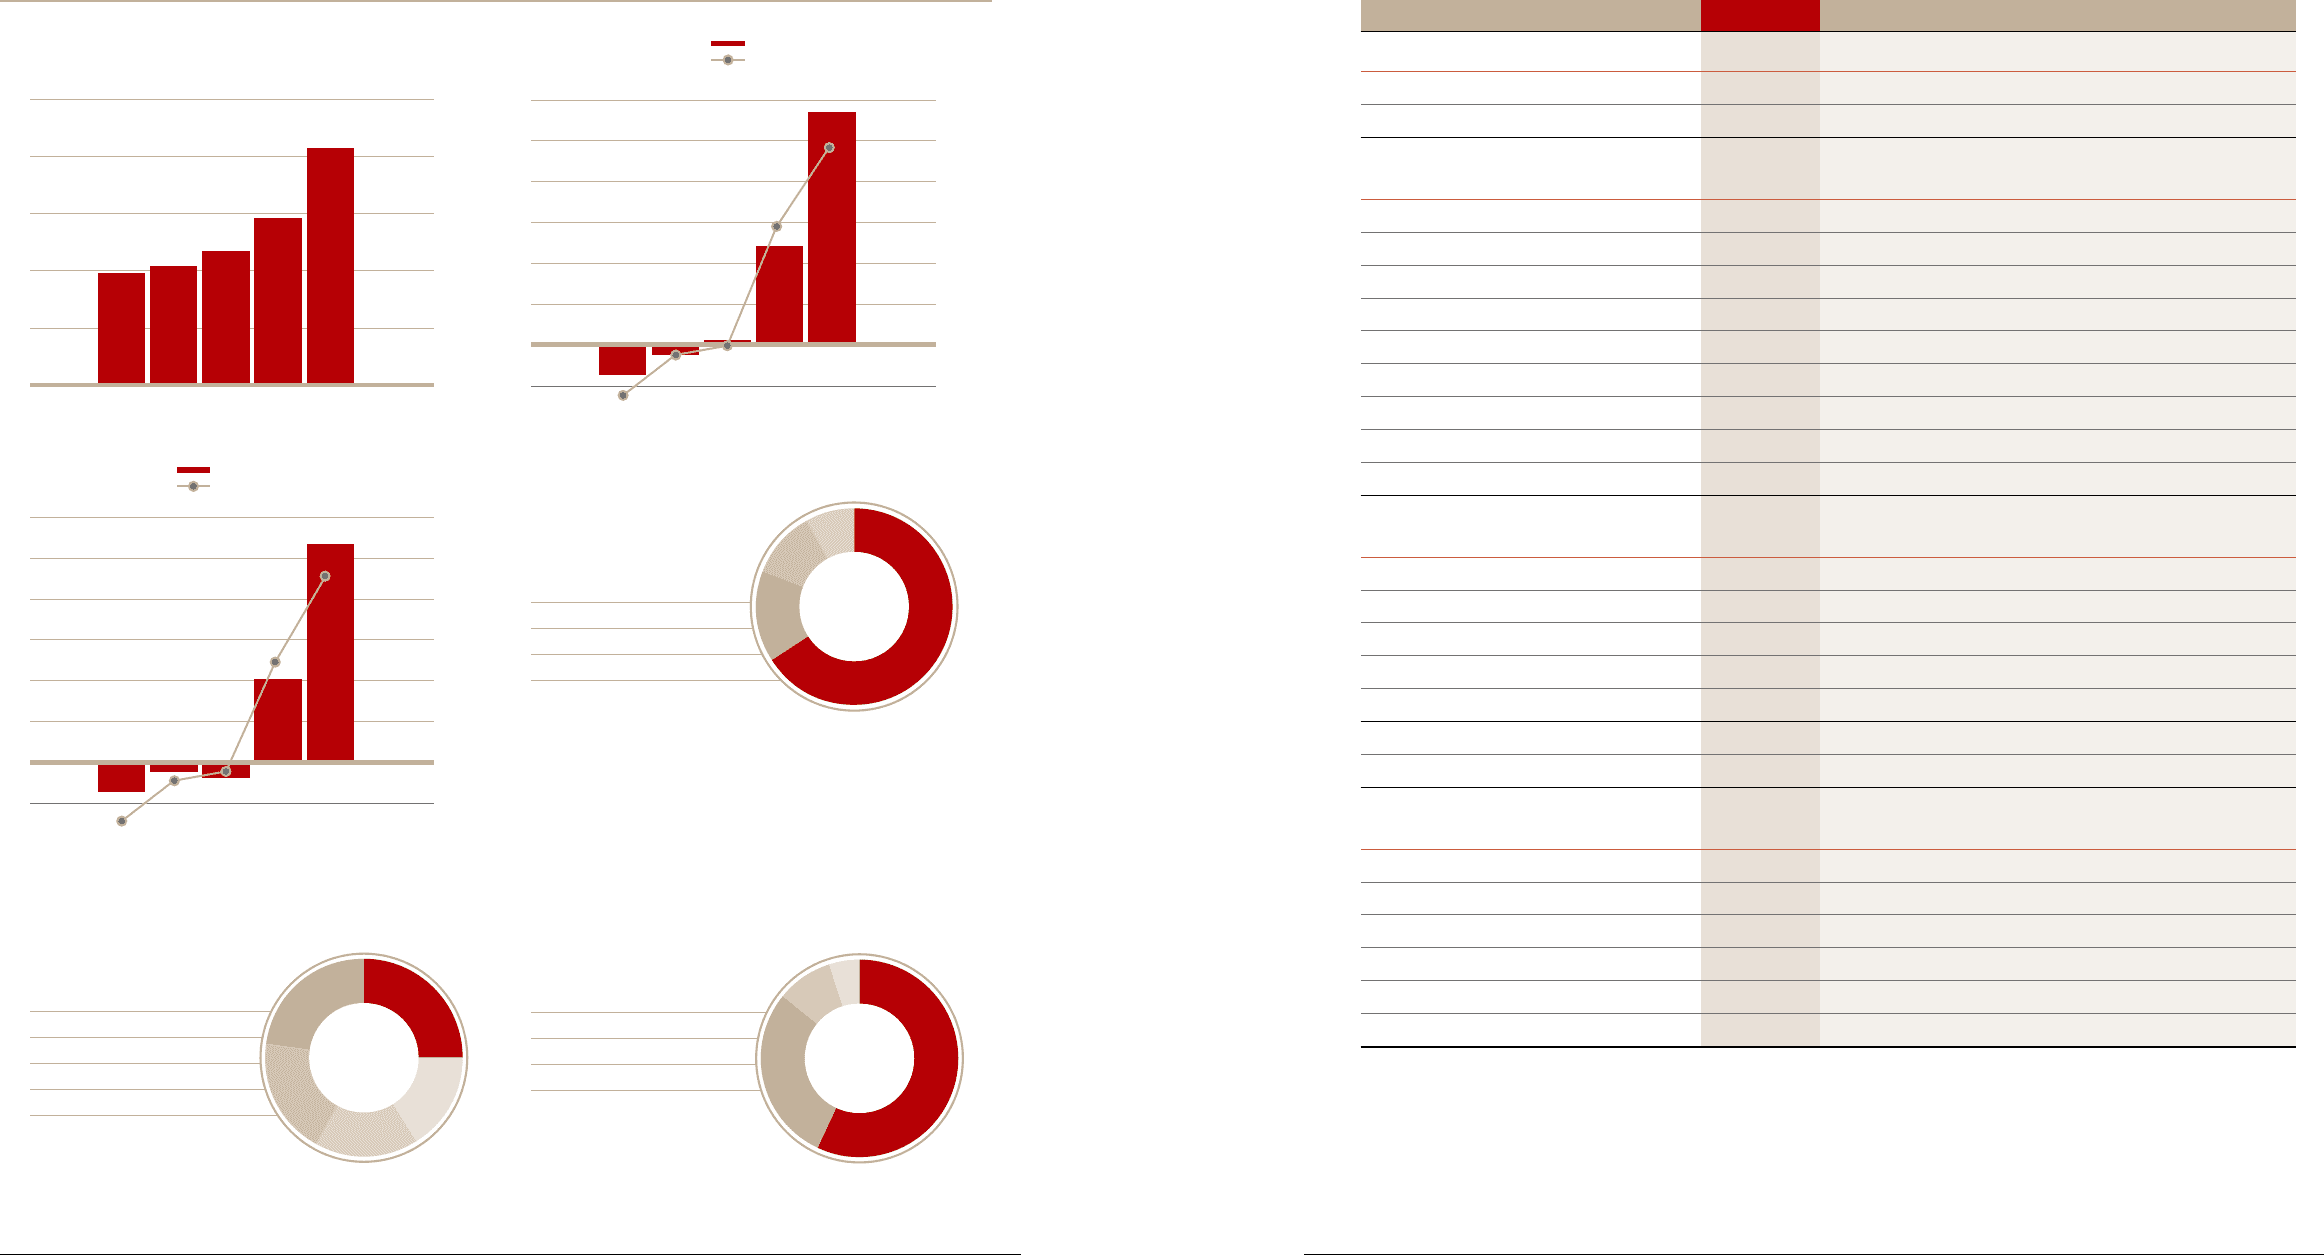
FINANCIAL HIGHLIGHTS
Sales Revenue
(Unit: KRW in billions)
2006 2007 2008 2009 2010
1,137
19,814.7
20,312.0
22,217.7
29,445.2
42,290.3
a. Korea 66%
b. China 15%
c. Slovakia 11%
d. US 8%
2010
Operating Profit
(Unit: KRW in billions)
a. A+B+C: 57%
b. RV: 29%
c. D+E: 9%
d. Others: 5%
2010
Retail Sales by Segment
Operating Profit
% of Revenue
Sales by Plants
Total Sales Volume:
2,130 thousand units
a
a
b
c
c
b
d
d
-1.8
-0.3
2006 2007 2008 2009 2010
1,145
1,531
0.7
0.0
4.1
6.7
2,836.1
1,195.2
(57.9)
(365.2)
Net Income
(Unit: KRW in billions)
Operating Profit
% of Revenue
-1.5
-0.7
2006 2007 2008 2009 2010
1,145
1,531
3.3
6.2
2,640.7
979.4
(290.8)
(151.5)
-0.4
Retail Sales by Region
a. Rest of World 25%
b. Korea 23%
c. Europe* 19%
d. US 17%
e. China 16%
Total Retail Sales:
2,088 thousand units
* Europe includes Western and Eastern Europe.
2010
b
c
d
e
a
Consolidated Performance
Consolidated Performance
(90.1)
08 09
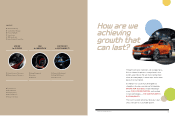
COMPONENTS OF SUSTAINABLE GROWTH KIA MOTORS ANNUAL REPORT 2010