Home Depot 2009 Annual Report Download - page 69
Download and view the complete annual report
Please find page 69 of the 2009 Home Depot annual report below. You can navigate through the pages in the report by either clicking on the pages listed below, or by using the keyword search tool below to find specific information within the annual report.-
 1
1 -
2
-
3
-
4
-
5
-
6
-
7
-
8
-
9
-
10
-
11
-
12
-
13
-
14
-
15
-
16
-
17
-
18
-
19
-
20
-
21
-
22
-
23
-
24
-
25
-
26
-
27
-
28
-
29
-
30
-
31
-
32
-
33
-
34
-
35
-
36
-
37
-
38
-
39
-
40
-
41
-
42
-
43
-
44
-
45
-
46
-
47
-
48
-
49
-
50
-
51
-
52
-
53
-
54
-
55
-
56
-
57
-
58
-
 59
59 -
 60
60 -
 61
61 -
 62
62 -
 63
63 -
 64
64 -
 65
65 -
 66
66 -
 67
67 -
 68
68 -
 69
69 -
 70
70 -
 71
71 -
 72
72
 |
 |

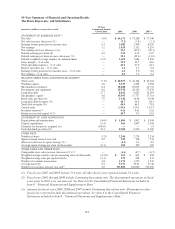
2006 2005 2004 2003 2002 2001(1) 2000
$ 79,022 $ 77,019 $ 71,100 $ 63,660 $ 58,247 $ 53,553 $ 45,738
2.6 8.3 11.7 9.3 8.8 17.1 19.0
8,502 8,967 7,790 6,762 5,872 4,957 4,217
5,266 5,641 4,922 4,253 3,664 3,044 2,581
(6.6) 14.6 15.7 16.1 20.4 17.9 11.3
2.55 2.63 2.22 1.86 1.56 1.29 1.10
(3.0) 18.5 19.4 19.2 20.9 17.3 10.0
2,062 2,147 2,216 2,289 2,344 2,353 2,352
33.6 33.7 33.4 31.7 31.1 30.2 29.9
22.4 21.9 22.4 21.1 21.1 20.9 20.7
0.5 0.1 — — (0.1) — —
10.8 11.6 11.0 10.6 10.1 9.3 9.2
6.7 7.3 6.9 6.7 6.3 5.7 5.6
$ 52,263 $ 44,405 $ 39,020 $ 34,437 $ 30,011 $ 26,394 $ 21,385
5,069 2,563 3,818 3,774 3,882 3,860 3,392
12,822 11,401 10,076 9,076 8,338 6,725 6,556
26,605 24,901 22,726 20,063 17,168 15,375 13,068
11,643 2,672 2,148 856 1,321 1,250 1,545
25,030 26,909 24,158 22,407 19,802 18,082 15,004
12.71 12.67 11.06 9.93 8.38 7.71 6.46
46.5 9.9 8.9 3.8 6.7 6.9 10.3
46.6 15.2 8.9 6.1 6.7 6.9 10.3
1.39:1 1.20:1 1.37:1 1.40:1 1.48:1 1.59:1 1.77:1
4.5x 4.7x 4.9x 5.0x 5.3x 5.4x 5.1x
16.8 20.4 19.9 19.2 18.8 18.3 19.6
$ 1,886 $ 1,579 $ 1,319 $ 1,076 $ 903 $ 764 $ 601
3,542 3,881 3,948 3,508 2,749 3,393 3,574
4,268 2,546 727 215 235 190 26
0.675 0.400 0.325 0.26 0.21 0.17 0.16
2,147 2,042 1,890 1,707 1,532 1,333 1,134
224 215 201 183 166 146 123
4.2 7.0 9.8 10.2 14.1 18.5 22.6
105 105 106 107 108 109 108
(2.8) 3.1 5.1 3.7 (0.5) — 4
$ 723 $ 763 $ 766 $ 763 $ 772 $ 812 $ 864
358 377 375 371 370 394 415
1,330 1,330 1,295 1,246 1,161 1,091 937
58.90 57.98 54.89 51.15 49.43 48.64 48.65
364,400 344,800 323,100 298,800 280,900 256,300 227,300
(4) Includes Net Sales at locations open greater than 12 months, including relocated and remodeled stores.
Stores become comparable on the Monday following their 365th day of operation. Comparable store sales
is intended only as supplemental information and is not a substitute for Net Sales or Net Earnings
presented in accordance with generally accepted accounting principles.
(5) Comparable store sales in fiscal years prior to 2002 were reported to the nearest percent.
F-2