Home Depot 2009 Annual Report Download - page 41
Download and view the complete annual report
Please find page 41 of the 2009 Home Depot annual report below. You can navigate through the pages in the report by either clicking on the pages listed below, or by using the keyword search tool below to find specific information within the annual report.-
 1
1 -
2
-
3
-
4
-
5
-
6
-
7
-
8
-
9
-
10
-
11
-
12
-
13
-
14
-
15
-
16
-
17
-
18
-
19
-
20
-
21
-
22
-
23
-
24
-
25
-
26
-
27
-
28
-
29
-
30
-
 31
31 -
 32
32 -
 33
33 -
 34
34 -
 35
35 -
 36
36 -
 37
37 -
 38
38 -
 39
39 -
 40
40 -
 41
41 -
 42
42 -
 43
43 -
 44
44 -
 45
45 -
 46
46 -
 47
47 -
 48
48 -
 49
49 -
 50
50 -
 51
51 -
52
-
53
-
54
-
55
-
56
-
57
-
58
-
59
-
60
-
61
-
62
-
63
-
64
-
65
-
66
-
67
-
68
-
69
-
70
-
71
-
72
 |
 |

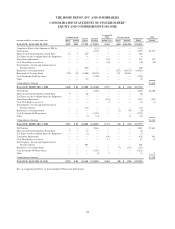
THE HOME DEPOT, INC. AND SUBSIDIARIES
CONSOLIDATED STATEMENTS OF CASH FLOWS
Fiscal Year Ended(1)
amounts in millions
January 31,
2010 February 1,
2009 February 3,
2008
CASH FLOWS FROM OPERATING ACTIVITIES:
Net Earnings $2,661 $2,260 $ 4,395
Reconciliation of Net Earnings to Net Cash Provided by Operating Activities:
Depreciation and Amortization 1,806 1,902 1,906
Impairment Related to Rationalization Charges —580 —
Impairment of Investment 163 163 —
Stock-Based Compensation Expense 201 176 207
Changes in Assets and Liabilities, net of the effects of acquisitions and disposition:
(Increase) Decrease in Receivables, net (23) 121 116
Decrease (Increase) in Merchandise Inventories 625 743 (491)
Decrease (Increase) in Other Current Assets 4(7) 109
Increase (Decrease) in Accounts Payable and Accrued Expenses 59 (646) (465)
Decrease in Deferred Revenue (21) (292) (159)
(Decrease) Increase in Income Taxes Payable (174) 262 —
Decrease in Deferred Income Taxes (227) (282) (348)
(Decrease) Increase in Other Long-Term Liabilities (19) 306 186
Other 70 242 271
Net Cash Provided by Operating Activities 5,125 5,528 5,727
CASH FLOWS FROM INVESTING ACTIVITIES:
Capital Expenditures, net of $10, $37 and $19 of non-cash capital
expenditures in fiscal 2009, 2008 and 2007, respectively (966) (1,847) (3,558)
Proceeds from Sale of Business, net —— 8,337
Payments for Businesses Acquired, net —— (13)
Proceeds from Sales of Property and Equipment 178 147 318
Purchases of Investments —(168) (11,225)
Proceeds from Sales and Maturities of Investments 33 139 10,899
Net Cash (Used in) Provided by Investing Activities (755) (1,729) 4,758
CASH FLOWS FROM FINANCING ACTIVITIES:
(Repayments of) Proceeds from Short-Term Borrowings, net —(1,732) 1,734
Repayments of Long-Term Debt (1,774) (313) (20)
Repurchases of Common Stock (213) (70) (10,815)
Proceeds from Sales of Common Stock 73 84 276
Cash Dividends Paid to Stockholders (1,525) (1,521) (1,709)
Other Financing Activities (64) (128) (105)
Net Cash Used in Financing Activities (3,503) (3,680) (10,639)
Increase (Decrease) in Cash and Cash Equivalents 867 119 (154)
Effect of Exchange Rate Changes on Cash and Cash Equivalents 35 (45) (1)
Cash and Cash Equivalents at Beginning of Year 519 445 600
Cash and Cash Equivalents at End of Year $1,421 $ 519 $ 445
SUPPLEMENTAL DISCLOSURE OF CASH PAYMENTS MADE FOR:
Interest, net of interest capitalized $ 664 $ 622 $ 672
Income Taxes $2,082 $1,265 $ 2,524
(1) Fiscal years ended January 31, 2010 and February 1, 2009 include 52 weeks. Fiscal year ended February 3, 2008
includes 53 weeks.
See accompanying Notes to Consolidated Financial Statements.
35