Home Depot 2009 Annual Report Download - page 27
Download and view the complete annual report
Please find page 27 of the 2009 Home Depot annual report below. You can navigate through the pages in the report by either clicking on the pages listed below, or by using the keyword search tool below to find specific information within the annual report.-
 1
1 -
2
-
3
-
4
-
5
-
6
-
7
-
8
-
9
-
10
-
11
-
12
-
13
-
14
-
15
-
16
-
 17
17 -
 18
18 -
 19
19 -
 20
20 -
 21
21 -
 22
22 -
 23
23 -
 24
24 -
 25
25 -
 26
26 -
 27
27 -
 28
28 -
 29
29 -
 30
30 -
 31
31 -
 32
32 -
 33
33 -
 34
34 -
 35
35 -
 36
36 -
 37
37 -
38
-
39
-
40
-
41
-
42
-
43
-
44
-
45
-
46
-
47
-
48
-
49
-
50
-
51
-
52
-
53
-
54
-
55
-
56
-
57
-
58
-
59
-
60
-
61
-
62
-
63
-
64
-
65
-
66
-
67
-
68
-
69
-
70
-
71
-
72
 |
 |

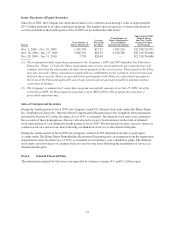
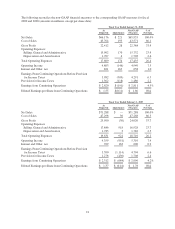
The following reconciles the non-GAAP financial measures to the corresponding GAAP measures for fiscal
2009 and 2008 (amounts in millions, except per share data):
Fiscal Year Ended January 31, 2010
As
Reported Adjustments Non-GAAP
Measures %of
Net Sales
Net Sales $66,176 $ 221 $65,955 100.0%
Cost of Sales 43,764 193 43,571 66.1
Gross Profit 22,412 28 22,384 33.9
Operating Expenses:
Selling, General and Administrative 15,902 170 15,732 23.9
Depreciation and Amortization 1,707 4 1,703 2.6
Total Operating Expenses 17,609 174 17,435 26.4
Operating Income 4,803 (146) 4,949 7.5
Interest and Other, net 821 163 658 1.0
Earnings From Continuing Operations Before Provision
for Income Taxes 3,982 (309) 4,291 6.5
Provision for Income Taxes 1,362 (118) 1,480 2.2
Earnings from Continuing Operations $ 2,620 $ (191) $ 2,811 4.3%
Diluted Earnings per Share from Continuing Operations $ 1.55 $(0.11) $ 1.66 N/A
Fiscal Year Ended February 1, 2009
As
Reported Adjustments Non-GAAP
Measures %of
Net Sales
Net Sales $71,288 $ — $71,288 100.0%
Cost of Sales 47,298 30 47,268 66.3
Gross Profit 23,990 (30) 24,020 33.7
Operating Expenses
Selling, General and Administrative 17,846 918 16,928 23.7
Depreciation and Amortization 1,785 3 1,782 2.5
Total Operating Expenses 19,631 921 18,710 26.2
Operating Income 4,359 (951) 5,310 7.4
Interest and Other, net 769 163 606 0.9
Earnings From Continuing Operations Before Provision
for Income Taxes 3,590 (1,114) 4,704 6.6
Provision for Income Taxes 1,278 (430) 1,708 2.4
Earnings from Continuing Operations $ 2,312 $ (684) $ 2,996 4.2%
Diluted Earnings per Share from Continuing Operations $ 1.37 $ (0.41) $ 1.78 N/A
21