Home Depot 2009 Annual Report Download - page 20
Download and view the complete annual report
Please find page 20 of the 2009 Home Depot annual report below. You can navigate through the pages in the report by either clicking on the pages listed below, or by using the keyword search tool below to find specific information within the annual report.-
 1
1 -
2
-
3
-
4
-
5
-
6
-
7
-
8
-
9
-
 10
10 -
 11
11 -
 12
12 -
 13
13 -
 14
14 -
 15
15 -
 16
16 -
 17
17 -
 18
18 -
 19
19 -
 20
20 -
 21
21 -
 22
22 -
 23
23 -
 24
24 -
 25
25 -
 26
26 -
 27
27 -
 28
28 -
 29
29 -
 30
30 -
31
-
32
-
33
-
34
-
35
-
36
-
37
-
38
-
39
-
40
-
41
-
42
-
43
-
44
-
45
-
46
-
47
-
48
-
49
-
50
-
51
-
52
-
53
-
54
-
55
-
56
-
57
-
58
-
59
-
60
-
61
-
62
-
63
-
64
-
65
-
66
-
67
-
68
-
69
-
70
-
71
-
72
 |
 |
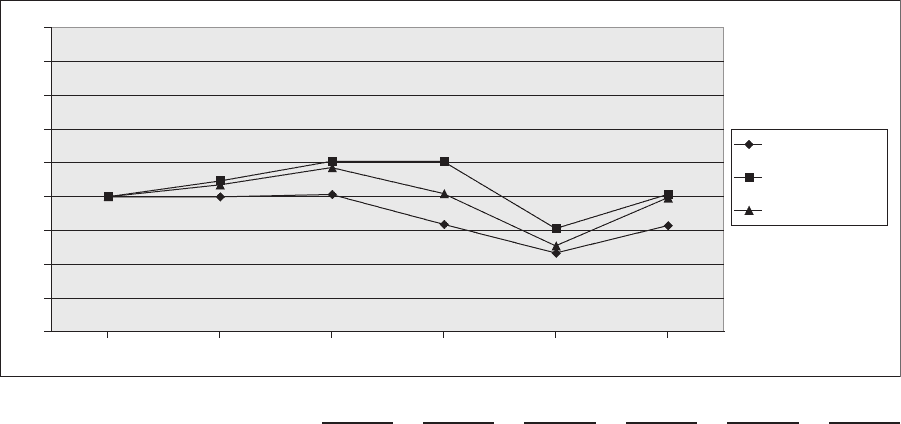
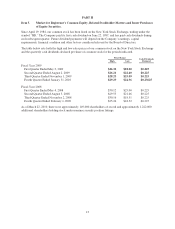
Stock Performance Graph
This graph depicts the Company’s cumulative total shareholder returns relative to the performance of the
Standard & Poor’s 500 Composite Stock Index and the Standard & Poor’s Retail Composite Index for the five-
year period commencing January 31, 2005, the first trading day of fiscal 2005, and ending January 29, 2010, the
last trading day of fiscal 2009. The graph assumes $100 invested at the closing price of the Company’s common
stock on the New York Stock Exchange and each index on January 28, 2005 and assumes that all dividends
were reinvested on the date paid. The points on the graph represent fiscal year-end amounts based on the last
trading day in each fiscal year.
January 28, 2005 January 27, 2006 January 26, 2007 February 1, 2008 January 30, 2009 January 29, 2010
$0
$25
$50
$75
$100
$125
$150
$175
$200
$225
The Home Depot
S&P 500 Index
S&P Retail Composite
Fiscal 2004 Fiscal 2005 Fiscal 2006 Fiscal 2007 Fiscal 2008 Fiscal 2009
The Home Depot $100.00 $ 99.97 $101.64 $ 79.54 $58.25 $ 78.64
S&P 500 Index $100.00 $111.62 $126.01 $126.05 $76.42 $101.75
S&P Retail Composite Index $100.00 $108.76 $121.44 $102.17 $63.63 $ 98.97
14