Home Depot 2009 Annual Report Download - page 31
Download and view the complete annual report
Please find page 31 of the 2009 Home Depot annual report below. You can navigate through the pages in the report by either clicking on the pages listed below, or by using the keyword search tool below to find specific information within the annual report.-
 1
1 -
2
-
3
-
4
-
5
-
6
-
7
-
8
-
9
-
10
-
11
-
12
-
13
-
14
-
15
-
16
-
17
-
18
-
19
-
20
-
 21
21 -
 22
22 -
 23
23 -
 24
24 -
 25
25 -
 26
26 -
 27
27 -
 28
28 -
 29
29 -
 30
30 -
 31
31 -
 32
32 -
 33
33 -
 34
34 -
 35
35 -
 36
36 -
 37
37 -
 38
38 -
 39
39 -
 40
40 -
 41
41 -
42
-
43
-
44
-
45
-
46
-
47
-
48
-
49
-
50
-
51
-
52
-
53
-
54
-
55
-
56
-
57
-
58
-
59
-
60
-
61
-
62
-
63
-
64
-
65
-
66
-
67
-
68
-
69
-
70
-
71
-
72
 |
 |

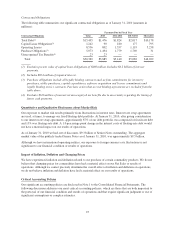
Contractual Obligations
The following table summarizes our significant contractual obligations as of January 31, 2010 (amounts in
millions):
Payments Due by Fiscal Year
Contractual Obligations Total 2010 2011-2012 2013-2014 Thereafter
Total Debt(1) $15,495 $1,476 $1,824 $2,017 $10,178
Capital Lease Obligations(2) 1,242 90 180 177 795
Operating Leases 8,536 802 1,357 1,119 5,258
Purchase Obligations(3) 5,073 1,494 1,779 1,769 31
Unrecognized Tax Benefits(4) 23 23 — — —
Total $30,369 $3,885 $5,140 $5,082 $16,262
(1) Excludes present value of capital lease obligations of $408 million. Includes $6.2 billion of interest
payments.
(2) Includes $834 million of imputed interest.
(3) Purchase obligations include all legally binding contracts such as firm commitments for inventory
purchases, utility purchases, capital expenditures, software acquisition and license commitments and
legally binding service contracts. Purchase orders that are not binding agreements are excluded from the
table above.
(4) Excludes $636 million of noncurrent unrecognized tax benefits due to uncertainty regarding the timing of
future cash payments.
Quantitative and Qualitative Disclosures about Market Risk
Our exposure to market risk results primarily from fluctuations in interest rates. Interest rate swap agreements
are used, at times, to manage our fixed/floating debt portfolio. At January 31, 2010, after giving consideration
to our interest rate swap agreements, approximately 87% of our debt portfolio was comprised of fixed-rate debt
and 13% was floating-rate debt. A 1.0 percentage point change in the interest costs of floating-rate debt would
not have a material impact on our results of operations.
As of January 31, 2010 we had, net of discounts, $9.3 billion of Senior Notes outstanding. The aggregate
market value of the publicly traded Senior Notes as of January 31, 2010, was approximately $9.5 billion.
Although we have international operating entities, our exposure to foreign currency rate fluctuations is not
significant to our financial condition or results of operations.
Impact of Inflation, Deflation and Changing Prices
We have experienced inflation and deflation related to our purchase of certain commodity products. We do not
believe that changing prices for commodities have had a material effect on our Net Sales or results of
operations. Although we cannot precisely determine the overall effect of inflation and deflation on operations,
we do not believe inflation and deflation have had a material effect on our results of operations.
Critical Accounting Policies
Our significant accounting policies are disclosed in Note 1 to the Consolidated Financial Statements. The
following discussion addresses our most critical accounting policies, which are those that are both important to
the portrayal of our financial condition and results of operations and that require significant judgment or use of
significant assumptions or complex estimates.
25