Home Depot 2009 Annual Report Download - page 26
Download and view the complete annual report
Please find page 26 of the 2009 Home Depot annual report below. You can navigate through the pages in the report by either clicking on the pages listed below, or by using the keyword search tool below to find specific information within the annual report.-
 1
1 -
2
-
3
-
4
-
5
-
6
-
7
-
8
-
9
-
10
-
11
-
12
-
13
-
14
-
15
-
 16
16 -
 17
17 -
 18
18 -
 19
19 -
 20
20 -
 21
21 -
 22
22 -
 23
23 -
 24
24 -
 25
25 -
 26
26 -
 27
27 -
 28
28 -
 29
29 -
 30
30 -
 31
31 -
 32
32 -
 33
33 -
 34
34 -
 35
35 -
 36
36 -
37
-
38
-
39
-
40
-
41
-
42
-
43
-
44
-
45
-
46
-
47
-
48
-
49
-
50
-
51
-
52
-
53
-
54
-
55
-
56
-
57
-
58
-
59
-
60
-
61
-
62
-
63
-
64
-
65
-
66
-
67
-
68
-
69
-
70
-
71
-
72
 |
 |
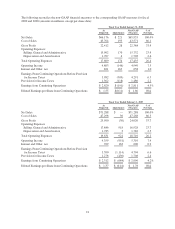
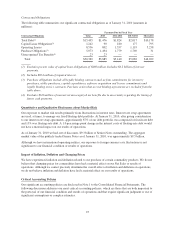
Rationalization Charges, Operating Income as a percent of Net Sales was 7.5% for fiscal 2009 compared to
7.4% for fiscal 2008.
Interest and Other, net
In fiscal 2009, we recognized $821 million of Interest and Other, net, compared to $769 million in fiscal 2008.
Interest and Other, net, as a percent of Net Sales was 1.2% for fiscal 2009 compared to 1.1% for fiscal 2008.
Interest and Other, net, reflects a $163 million charge in each of fiscal 2009 and 2008 to write-down our
investment in HD Supply. Excluding these charges, Interest and Other, net, as a percent of Net Sales was 1.0%
for fiscal 2009 compared to 0.9% for fiscal 2008. The increase in Interest and Other, net, as a percent of Net
Sales was primarily due to lower sales.
Provision for Income Taxes
Our combined effective income tax rate for continuing operations decreased to 34.2% for fiscal 2009 from
35.6% for fiscal 2008. The decrease in our effective income tax rate for fiscal 2009 reflects benefits arising
from a favorable foreign tax settlement and realignment of our foreign corporate structure. These benefits
positively impacted Diluted Earnings per Share by approximately $0.06 for fiscal 2009.
Diluted Earnings per Share from Continuing Operations
Diluted Earnings per Share from Continuing Operations were $1.55 for fiscal 2009 and $1.37 for fiscal 2008.
Excluding the Rationalization Charges and the write-downs of our investment in HD Supply, Diluted Earnings
per Share from Continuing Operations for fiscal 2009 were $1.66 compared to $1.78 for fiscal 2008, a decrease
of 6.7%.
Discontinued Operations
On August 30, 2007, the Company closed the sale of HD Supply. Discontinued operations for fiscal 2009
consist of earnings of $41 million, net of tax, or $0.02 per diluted share, compared to a loss of $52 million, net
of tax, or $0.03 per diluted share in fiscal 2008, in each case for the settlement of working capital matters
arising from the sale of HD Supply.
Non-GAAP Measures
To provide clarity, internally and externally, about our operating performance for fiscal 2009 and 2008, we
supplement our reporting with non-GAAP financial measures to reflect adjustments for the Rationalization
Charges as described more fully in Note 2 to the Consolidated Financial Statements, as well as the Net Sales
from Exited Businesses during the period from closing announcement to actual closing, and the charges to
write-down our investment in HD Supply as described in Note 4 to the Consolidated Financial Statements. We
believe these non-GAAP financial measures better enable management and investors to understand and analyze
our performance by providing them with meaningful information relevant to events of unusual nature or
frequency. However, this supplemental information should not be considered in isolation or as a substitute for
the related GAAP measures.
20