Home Depot 2009 Annual Report Download - page 23
Download and view the complete annual report
Please find page 23 of the 2009 Home Depot annual report below. You can navigate through the pages in the report by either clicking on the pages listed below, or by using the keyword search tool below to find specific information within the annual report.-
 1
1 -
2
-
3
-
4
-
5
-
6
-
7
-
8
-
9
-
10
-
11
-
12
-
 13
13 -
 14
14 -
 15
15 -
 16
16 -
 17
17 -
 18
18 -
 19
19 -
 20
20 -
 21
21 -
 22
22 -
 23
23 -
 24
24 -
 25
25 -
 26
26 -
 27
27 -
 28
28 -
 29
29 -
 30
30 -
 31
31 -
 32
32 -
 33
33 -
34
-
35
-
36
-
37
-
38
-
39
-
40
-
41
-
42
-
43
-
44
-
45
-
46
-
47
-
48
-
49
-
50
-
51
-
52
-
53
-
54
-
55
-
56
-
57
-
58
-
59
-
60
-
61
-
62
-
63
-
64
-
65
-
66
-
67
-
68
-
69
-
70
-
71
-
72
 |
 |
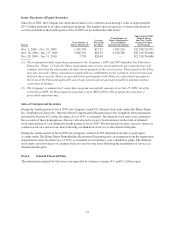
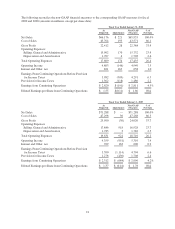
We generated $5.1 billion of cash flow from operations in fiscal 2009. We used a portion of this cash flow to
repay $1.8 billion of Long-Term Debt, pay $1.5 billion of dividends, fund $966 million in capital expenditures
and fund $213 million of share repurchases.
At the end of fiscal 2009, our long-term debt-to-equity ratio was 44.7% compared to 54.4% at the end of fiscal
2008. Our return on invested capital for continuing operations (computed on net operating profit after tax for
the trailing twelve months and the average of beginning and ending long-term debt and equity) was 10.7% at
the end of fiscal 2009 compared to 9.5% for fiscal 2008. Excluding Rationalization Charges, our return on
invested capital for continuing operations was 11.1% for fiscal 2009 compared to 11.4% for fiscal 2008.
17