Home Depot 2009 Annual Report Download - page 40
Download and view the complete annual report
Please find page 40 of the 2009 Home Depot annual report below. You can navigate through the pages in the report by either clicking on the pages listed below, or by using the keyword search tool below to find specific information within the annual report.-
 1
1 -
2
-
3
-
4
-
5
-
6
-
7
-
8
-
9
-
10
-
11
-
12
-
13
-
14
-
15
-
16
-
17
-
18
-
19
-
20
-
21
-
22
-
23
-
24
-
25
-
26
-
27
-
28
-
29
-
 30
30 -
 31
31 -
 32
32 -
 33
33 -
 34
34 -
 35
35 -
 36
36 -
 37
37 -
 38
38 -
 39
39 -
 40
40 -
 41
41 -
 42
42 -
 43
43 -
 44
44 -
 45
45 -
 46
46 -
 47
47 -
 48
48 -
 49
49 -
 50
50 -
51
-
52
-
53
-
54
-
55
-
56
-
57
-
58
-
59
-
60
-
61
-
62
-
63
-
64
-
65
-
66
-
67
-
68
-
69
-
70
-
71
-
72
 |
 |

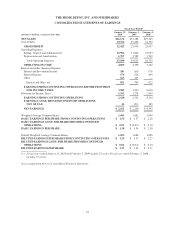
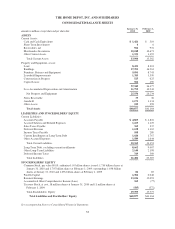
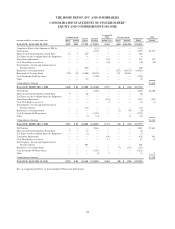
THE HOME DEPOT, INC. AND SUBSIDIARIES
CONSOLIDATED STATEMENTS OF STOCKHOLDERS’
EQUITY AND COMPREHENSIVE INCOME
Common Stock Paid-In
Capital Retained
Earnings
Accumulated
Other
Comprehensive
Income (Loss)
Treasury Stock Stockholders’
Equity
Total
Comprehensive
Incomeamounts in millions, except per share data Shares Amount Shares Amount
BALANCE, JANUARY 28, 2007 2,421 $121 $ 7,930 $ 33,052 $ 310 (451) $(16,383) $ 25,030
Cumulative Effect of the Adoption of FIN 48 — — — (111) — — — (111)
Net Earnings — — — 4,395 — — — 4,395 $4,395
Shares Issued Under Employee Stock Plans 12 1 239 — — — — 240
Tax Effect of Sale of Option Shares by Employees — — 4 — — — — 4
Translation Adjustments — — — — 455 — — 455 455
Cash Flow Hedges, net of tax — — — — (10) — — (10) (10)
Stock Options, Awards and Amortization of
Restricted Stock — — 206 — — — — 206
Repurchase of Common Stock — — — — — (292) (10,815) (10,815)
Retirement of Treasury Stock (735) (37) (2,608) (24,239) — 735 26,884 —
Cash Dividends ($0.90 per share) — — — (1,709) — — — (1,709)
Other — — 29 — — — — 29
Comprehensive Income $4,840
BALANCE, FEBRUARY 3, 2008 1,698 $ 85 $ 5,800 $ 11,388 $ 755 (8) $ (314) $ 17,714
Net Earnings — — — 2,260 — — — 2,260 $2,260
Shares Issued Under Employee Stock Plans 9 — 68 — — — — 68
Tax Effect of Sale of Option Shares by Employees — — 7 — — — — 7
Translation Adjustments — — — — (831) — — (831) (831)
Cash Flow Hedges, net of tax — — — — (1) — — (1) (1)
Stock Options, Awards and Amortization of
Restricted Stock — — 176 — — — — 176
Repurchase of Common Stock — — — — — (3) (70) (70)
Cash Dividends ($0.90 per share) — — — (1,521) — — — (1,521)
Other — — (3) (34) — — 12 (25)
Comprehensive Income $1,428
BALANCE, FEBRUARY 1, 2009 1,707 $ 85 $ 6,048 $ 12,093 $ (77) (11) $ (372) $ 17,777
Net Earnings — — — 2,661 — — — 2,661 $2,661
Shares Issued Under Employee Stock Plans 9 1 57 — — — — 58
Tax Effect of Sale of Option Shares by Employees — — (2) — — — — (2)
Translation Adjustments — — — — 426 — — 426 426
Cash Flow Hedges, net of tax — — — — 11 — — 11 11
Stock Options, Awards and Amortization of
Restricted Stock — — 201 — — — — 201
Repurchase of Common Stock — — — — — (7) (213) (213)
Cash Dividends ($0.90 per share) — — — (1,525) — — — (1,525)
Other — — — (3) 2 — — (1) 2
Comprehensive Income $3,100
BALANCE, JANUARY 31, 2010 1,716 $ 86 $ 6,304 $ 13,226 $ 362 (18) $ (585) $ 19,393
See accompanying Notes to Consolidated Financial Statements.
34