Home Depot 2009 Annual Report Download - page 58
Download and view the complete annual report
Please find page 58 of the 2009 Home Depot annual report below. You can navigate through the pages in the report by either clicking on the pages listed below, or by using the keyword search tool below to find specific information within the annual report.-
 1
1 -
2
-
3
-
4
-
5
-
6
-
7
-
8
-
9
-
10
-
11
-
12
-
13
-
14
-
15
-
16
-
17
-
18
-
19
-
20
-
21
-
22
-
23
-
24
-
25
-
26
-
27
-
28
-
29
-
30
-
31
-
32
-
33
-
34
-
35
-
36
-
37
-
38
-
39
-
40
-
41
-
42
-
43
-
44
-
45
-
46
-
47
-
 48
48 -
 49
49 -
 50
50 -
 51
51 -
 52
52 -
 53
53 -
 54
54 -
 55
55 -
 56
56 -
 57
57 -
 58
58 -
 59
59 -
 60
60 -
 61
61 -
 62
62 -
 63
63 -
 64
64 -
 65
65 -
 66
66 -
 67
67 -
 68
68 -
69
-
70
-
71
-
72
 |
 |

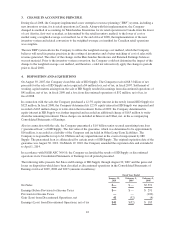
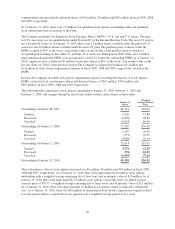
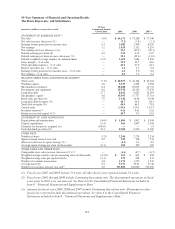
Stock plans include shares granted under the Company’s employee stock plans as described in Note 7 to the
Consolidated Financial Statements. Options to purchase 48 million, 52 million and 43 million shares of
common stock at January 31, 2010, February 1, 2009 and February 3, 2008, respectively, were excluded from
the computation of Diluted Earnings per Share because their effect would have been anti-dilutive.
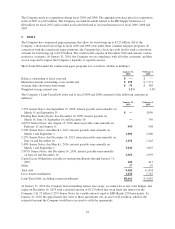
11. FAIR VALUE MEASUREMENTS
The fair value of an asset is considered to be the price at which the asset could be sold in an orderly transaction
between unrelated knowledgeable and willing parties. A liability’s fair value is defined as the amount that
would be paid to transfer the liability to a new obligor, not the amount that would be paid to settle the liability
with the creditor. Assets and liabilities recorded at fair value are measured using a three-tier fair value
hierarchy, which prioritizes the inputs used in measuring fair value. These tiers include:
• Level 1 – Observable inputs that reflect quoted prices in active markets
• Level 2 – Inputs other than quoted prices in active markets that are either directly or indirectly observable
• Level 3 – Unobservable inputs in which little or no market data exists, therefore requiring the Company
to develop its own assumptions
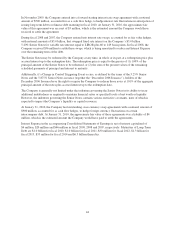
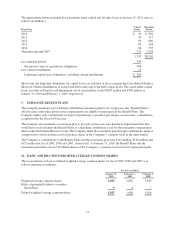
Assets and Liabilities Measured at Fair Value on a Recurring Basis
The assets and liabilities that are measured at fair value on a recurring basis as of January 31, 2010 are as
follows (in millions):
Fair Value at Reporting Date Using
Level 1 Level 2 Level 3
Available-for-sale securities $ 6 $— $—
Derivative agreements - assets — 15 —
Derivative agreements - liabilities — (4) —
Total $ 6 $11 $—
The Company’s available-for-sale securities are discussed further under the caption “Short-Term Investments”
in Note 1. The Company’s derivative agreements are discussed further in Note 5.
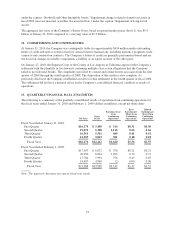
Assets and Liabilities Measured at Fair Value on a Nonrecurring Basis
The assets and liabilities that are measured at fair value on a nonrecurring basis as of January 31, 2010 are as
follows (in millions):
Fair Value
Level 3 Fiscal 2009
Gains (Losses)
HD Supply investment $ — $(163)
Store Rationalization - lease obligation costs, net (191) (84)
Total $(191) $(247)
During fiscal 2009, the Company impaired the remaining value of its investment in HD Supply using fair value
measurements with unobservable inputs (level 3), as further discussed in Note 4. Additionally, lease obligation
costs included in the Company’s Rationalization Charges were measured on a nonrecurring basis using fair
value measurements with unobservable inputs (level 3), as further discussed in Note 2.
Long-lived assets and goodwill and other intangible assets were also analyzed for impairment on a nonrecurring
basis using fair value measurements with unobservable inputs (level 3). The Company did not record any
impairment charges related to goodwill and other intangible assets in fiscal 2009 as further discussed in Note 1
52