Home Depot 2009 Annual Report Download - page 25
Download and view the complete annual report
Please find page 25 of the 2009 Home Depot annual report below. You can navigate through the pages in the report by either clicking on the pages listed below, or by using the keyword search tool below to find specific information within the annual report.-
 1
1 -
2
-
3
-
4
-
5
-
6
-
7
-
8
-
9
-
10
-
11
-
12
-
13
-
14
-
 15
15 -
 16
16 -
 17
17 -
 18
18 -
 19
19 -
 20
20 -
 21
21 -
 22
22 -
 23
23 -
 24
24 -
 25
25 -
 26
26 -
 27
27 -
 28
28 -
 29
29 -
 30
30 -
 31
31 -
 32
32 -
 33
33 -
 34
34 -
 35
35 -
36
-
37
-
38
-
39
-
40
-
41
-
42
-
43
-
44
-
45
-
46
-
47
-
48
-
49
-
50
-
51
-
52
-
53
-
54
-
55
-
56
-
57
-
58
-
59
-
60
-
61
-
62
-
63
-
64
-
65
-
66
-
67
-
68
-
69
-
70
-
71
-
72
 |
 |

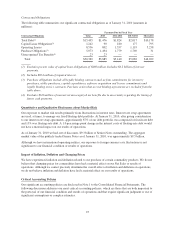
Results of Operations
For an understanding of the significant factors that influenced our performance during the past three fiscal
years, the following discussion should be read in conjunction with the Consolidated Financial Statements and
the Notes to Consolidated Financial Statements presented in this report.
Fiscal 2009 Compared to Fiscal 2008
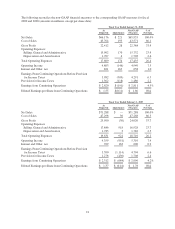
Net Sales
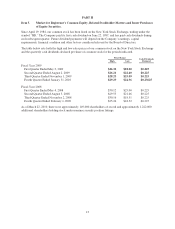
Net Sales for fiscal 2009 decreased 7.2% to $66.2 billion from $71.3 billion for fiscal 2008. The decrease in Net
Sales for fiscal 2009 reflects the impact of negative comparable store sales as well as the net impact of fewer
open stores in fiscal 2009 versus fiscal 2008. Total comparable store sales decreased 6.6% for fiscal 2009
compared to a decrease of 8.7% for fiscal 2008.
There were a number of factors that contributed to our comparable store sales decline. The U.S. residential
construction, housing and home improvement markets continued to be soft, and consumers were challenged due
to a number of factors including higher unemployment. We saw relative strength in our Building Materials,
Flooring, Paint, Plumbing and Garden/Seasonal product categories as comparable store sales in these areas
were above the Company average for fiscal 2009. Comparable store sales for our Lumber, Hardware, Electrical,
Kitchen/Bath and Millwork product categories were below the Company average for fiscal 2009. In fiscal 2009,
we also saw significant strengthening of the U.S. dollar against all currencies. Fluctuating exchange rates
negatively impacted our total Company sales by approximately $565 million for fiscal 2009 compared to last
year.
We believe that our sales performance has been, and could continue to be, negatively impacted by the level of
competition that we encounter in various markets. We estimate our share of the U.S. home improvement market
is approximately 21%.
Gross Profit
Gross Profit decreased 6.6% to $22.4 billion for fiscal 2009 from $24.0 billion for fiscal 2008. Gross Profit as a
percent of Net Sales was 33.9% for fiscal 2009 compared to 33.7% for fiscal 2008, an increase of 22 basis
points. Through our focused bay portfolio approach, our U.S. merchants continued to introduce new lower
prices while growing overall gross margin. Additionally, gross margin expansion for fiscal 2009 was driven by
lower markdowns as compared to last year.
Operating Expenses
Selling, General and Administrative expenses (“SG&A”) decreased 10.9% to $15.9 billion for fiscal 2009 from
$17.8 billion for fiscal 2008. As a percent of Net Sales, SG&A was 24.0% for fiscal 2009 compared to 25.0%
for fiscal 2008. Excluding the Rationalization Charges, SG&A as a percent of Net Sales was 23.9% for fiscal
2009 compared to 23.7% for fiscal 2008. Our SG&A results for fiscal 2009 reflect the impact of a negative
comparable store sales environment, offset by a lower cost of credit associated with the private label credit card
program and solid expense control. For fiscal 2009, the penetration of the private label credit card sales was
25.1% compared to 28.1% for fiscal 2008.
Depreciation and Amortization decreased 4.4% to $1.7 billion for fiscal 2009 from $1.8 billion for fiscal 2008.
Depreciation and Amortization as a percent of Net Sales was 2.6% for fiscal 2009 and 2.5% for fiscal 2008.
The increase in Depreciation and Amortization as a percent of Net Sales was primarily due to lower sales.
Operating Income
Operating Income increased 10.2% to $4.8 billion for fiscal 2009 from $4.4 billion for fiscal 2008. Operating
Income as a percent of Net Sales was 7.3% for fiscal 2009 compared to 6.1% for fiscal 2008. Excluding the
19