Home Depot 2009 Annual Report Download - page 68
Download and view the complete annual report
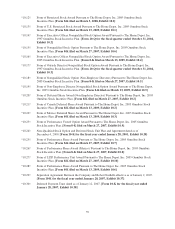
Please find page 68 of the 2009 Home Depot annual report below. You can navigate through the pages in the report by either clicking on the pages listed below, or by using the keyword search tool below to find specific information within the annual report.-
 1
1 -
2
-
3
-
4
-
5
-
6
-
7
-
8
-
9
-
10
-
11
-
12
-
13
-
14
-
15
-
16
-
17
-
18
-
19
-
20
-
21
-
22
-
23
-
24
-
25
-
26
-
27
-
28
-
29
-
30
-
31
-
32
-
33
-
34
-
35
-
36
-
37
-
38
-
39
-
40
-
41
-
42
-
43
-
44
-
45
-
46
-
47
-
48
-
49
-
50
-
51
-
52
-
53
-
54
-
55
-
56
-
57
-
 58
58 -
 59
59 -
 60
60 -
 61
61 -
 62
62 -
 63
63 -
 64
64 -
 65
65 -
 66
66 -
 67
67 -
 68
68 -
 69
69 -
 70
70 -
 71
71 -
 72
72
 |
 |

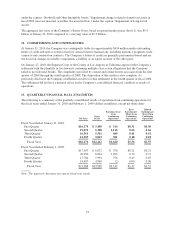
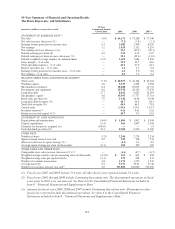
10-Year Summary of Financial and Operating Results
The Home Depot, Inc. and Subsidiaries
amounts in millions, except where noted
10-Year
Compound Annual
Growth Rate 2009 2008 2007(1)
STATEMENT OF EARNINGS DATA(2)
Net sales 5.6% $ 66,176 $ 71,288 $ 77,349
Net sales increase (decrease) (%) — (7.2) (7.8) (2.1)
Earnings before provision for income taxes 0.5 3,982 3,590 6,620
Net earnings 1.2 2,620 2,312 4,210
Net earnings increase (decrease) (%) — 13.3 (45.1) (20.1)
Diluted earnings per share ($) 4.5 1.55 1.37 2.27
Diluted earnings per share increase (decrease) (%) — 13.1 (39.6) (11.0)
Diluted weighted average number of common shares (3.2) 1,692 1,686 1,856
Gross margin – % of sales — 33.9 33.7 33.6
Total operating expenses – % of sales — 26.6 27.5 24.3
Interest and other, net – % of sales — 1.2 1.1 0.8
Earnings before provision for income taxes – % of sales — 6.0 5.0 8.6
Net earnings – % of sales — 4.0 3.2 5.4
BALANCE SHEET DATA AND FINANCIAL RATIOS(3)
Total assets 9.1% $ 40,877 $ 41,164 $ 44,324
Working capital 2.6 3,537 2,209 1,968
Merchandise inventories 6.4 10,188 10,673 11,731
Net property and equipment 9.6 25,550 26,234 27,476
Long-term debt 27.7 8,662 9,667 11,383
Stockholders’ equity 4.6 19,393 17,777 17,714
Book value per share ($) 7.9 11.42 10.48 10.48
Long-term debt-to-equity (%) — 44.7 54.4 64.3
Total debt-to-equity (%) — 49.9 64.3 75.8
Current ratio — 1.34:1 1.20:1 1.15:1
Inventory turnover(2) —4.1x 4.0x 4.2x
Return on invested capital (%)(2) —10.7 9.5 13.9
STATEMENT OF CASH FLOWS DATA
Depreciation and amortization 14.6% $ 1,806 $ 1,902 $ 1,906
Capital expenditures (9.5) 966 1,847 3,558
Payments for businesses acquired, net (100.0) ——13
Cash dividends per share ($) 23.3 0.900 0.900 0.900
STORE DATA
Number of stores 9.2% 2,244 2,274 2,234
Square footage at fiscal year-end 8.9 235 238 235
(Decrease) increase in square footage (%) — (1.3) 1.3 4.9
Average square footage per store (in thousands) (0.3) 105 105 105
STORE SALES AND OTHER DATA
Comparable store sales increase (decrease) (%)(4)(5) —(6.6) (8.7) (6.7)
Weighted average weekly sales per operating store (in thousands) (4.3)% $ 563 $ 601 $ 658
Weighted average sales per square foot ($) (4.1) 279 298 332
Number of customer transactions 4.8 1,274 1,272 1,336
Average ticket ($) 0.8 51.76 55.61 57.48
Number of associates at fiscal year-end(3) 4.6 317,000 322,000 331,000
(1) Fiscal years 2007 and 2001 include 53 weeks; all other fiscal years reported include 52 weeks.
(2) Fiscal years 2003 through 2009 include Continuing Operations only. The discontinued operations in fiscal
years prior to 2003 were not material. See Note 4 to the Consolidated Financial Statements included in
Item 8, “Financial Statements and Supplementary Data.”
(3) Amounts for fiscal years 2009, 2008 and 2007 include Continuing Operations only. All amounts in other
fiscal years reported include discontinued operations. See Note 4 to the Consolidated Financial
Statements included in Item 8, “Financial Statements and Supplementary Data.”
F-1