Home Depot 2009 Annual Report Download - page 47
Download and view the complete annual report
Please find page 47 of the 2009 Home Depot annual report below. You can navigate through the pages in the report by either clicking on the pages listed below, or by using the keyword search tool below to find specific information within the annual report.-
 1
1 -
2
-
3
-
4
-
5
-
6
-
7
-
8
-
9
-
10
-
11
-
12
-
13
-
14
-
15
-
16
-
17
-
18
-
19
-
20
-
21
-
22
-
23
-
24
-
25
-
26
-
27
-
28
-
29
-
30
-
31
-
32
-
33
-
34
-
35
-
36
-
 37
37 -
 38
38 -
 39
39 -
 40
40 -
 41
41 -
 42
42 -
 43
43 -
 44
44 -
 45
45 -
 46
46 -
 47
47 -
 48
48 -
 49
49 -
 50
50 -
 51
51 -
 52
52 -
 53
53 -
 54
54 -
 55
55 -
 56
56 -
 57
57 -
58
-
59
-
60
-
61
-
62
-
63
-
64
-
65
-
66
-
67
-
68
-
69
-
70
-
71
-
72
 |
 |

2. RATIONALIZATION CHARGES
In fiscal 2008, the Company reduced its square footage growth plans to improve free cash flow, provide
stronger returns for the Company and invest in its existing stores to continue improving the customer
experience. As a result of this store rationalization plan, the Company determined that it would no longer
pursue the opening of approximately 50 U.S. stores that had been in its new store pipeline. The Company
expects to dispose of or sublet these pipeline locations over varying periods. The Company also closed 15
underperforming U.S. stores in the second quarter of fiscal 2008, and the Company expects to dispose of or
sublet those locations over varying periods.
Also in fiscal 2008, the Company announced that it would exit its EXPO, THD Design Center, Yardbirds and
HD Bath businesses (the “Exited Businesses”) in order to focus on its core The Home Depot stores. The
Company closed the Exited Businesses in the first quarter of fiscal 2009 and expects to dispose of or sublet
those locations over varying periods. These steps impacted approximately 5,000 associates in those locations,
their support functions and their distribution centers.
Finally, in January 2009 the Company restructured its support functions to better align the Company’s cost
structure. These actions impacted approximately 2,000 associates.
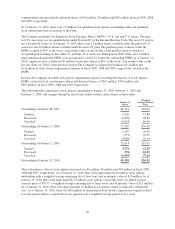
The Company recognized $146 million and $951 million in total pretax charges for fiscal 2009 and 2008,
respectively, related to these actions (collectively, the “Rationalization Charges”). The significant components
of the total expected charges and charges incurred to date are as follows (amounts in millions):
Total
Expected
Charges
Fiscal
2008
Charges
Fiscal
2009
Charges
Estimated
Remaining
Charges
Asset impairments $ 580 $580 $ — $ —
Lease obligation costs, net 336 252 84 —
Severance 86 78 8 —
Other 95 41 54 —
Total $1,097 $951 $146 $ —
Inventory markdown costs reflected in Other are included in Cost of Sales in the accompanying Consolidated
Statements of Earnings, and costs related to asset impairments, lease obligations, severance and other
miscellaneous costs are included in SG&A expenses. Asset impairment charges, including contractual costs to
complete certain assets, were determined based on fair market value using market data for each individual
property. Lease obligation costs represent the present value of contractually obligated rental payments offset by
estimated sublet income, including estimates of the time required to sublease the locations. The payments
related to the leased locations therefore are not generally incremental uses of cash.
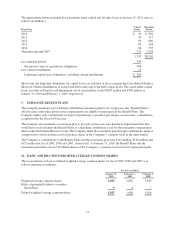
Activity related to Rationalization Charges for fiscal 2009 and 2008 was as follows (amounts in millions):
Fiscal
2008
Charges Cash
Uses Non-cash
Uses
Accrued
Balance
February 1,
2009
Fiscal
2009
Charges Cash
Uses Non-cash
Uses
Accrued
Balance
January 31,
2010
Asset impairments $580 $— $542 $ 38 $ — $ — $15 $ 23
Lease obligation costs, net 252 39 — 213 84 106 — 191
Severance 78 6 — 72 8 80 — —
Other 41 18 3 20 54 71 3 —
Total $951 $63 $545 $343 $146 $257 $18 $214
41