Home Depot 2009 Annual Report Download - page 55
Download and view the complete annual report
Please find page 55 of the 2009 Home Depot annual report below. You can navigate through the pages in the report by either clicking on the pages listed below, or by using the keyword search tool below to find specific information within the annual report.-
 1
1 -
2
-
3
-
4
-
5
-
6
-
7
-
8
-
9
-
10
-
11
-
12
-
13
-
14
-
15
-
16
-
17
-
18
-
19
-
20
-
21
-
22
-
23
-
24
-
25
-
26
-
27
-
28
-
29
-
30
-
31
-
32
-
33
-
34
-
35
-
36
-
37
-
38
-
39
-
40
-
41
-
42
-
43
-
44
-
 45
45 -
 46
46 -
 47
47 -
 48
48 -
 49
49 -
 50
50 -
 51
51 -
 52
52 -
 53
53 -
 54
54 -
 55
55 -
 56
56 -
 57
57 -
 58
58 -
 59
59 -
 60
60 -
 61
61 -
 62
62 -
 63
63 -
 64
64 -
 65
65 -
66
-
67
-
68
-
69
-
70
-
71
-
72
 |
 |

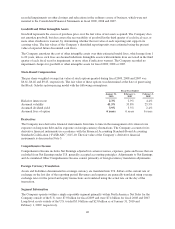
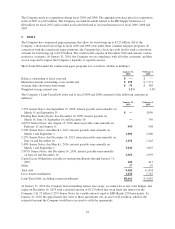
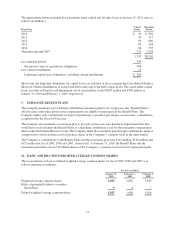
compensation expense related to deferred shares of $14 million, $9 million and $10 million in fiscal 2009, 2008
and 2007, respectively.
As of January 31, 2010, there were 2.5 million non-qualified stock options outstanding under non-qualified
stock option plans that are not part of the Plans.
The Company maintains two Employee Stock Purchase Plans (“ESPPs”) (U.S. and non-U.S. plans). The plan
for U.S. associates is a tax-qualified plan under Section 423 of the Internal Revenue Code. The non-U.S. plan is
not a Section 423 plan. As of January 31, 2010, there were 13 million shares available under the plan for U.S
associates and 20 million shares available under the non-U.S. plan. The purchase price of shares under the
ESPPs is equal to 85% of the stock’s fair market value on the last day of the purchase period, which is a
six-month period ending on December 31 and June 30 of each year. During fiscal 2009, there were 3 million
shares purchased under the ESPPs at an average price of $22.34. Under the outstanding ESPPs as of January 31,
2010, employees have contributed $7 million to purchase shares at 85% of the stock’s fair market value on the
last day (June 30, 2010) of the purchase period. The Company recognized $10 million, $11 million and
$14 million of stock-based compensation expense in fiscal 2009, 2008 and 2007, respectively, related to the
ESPPs.
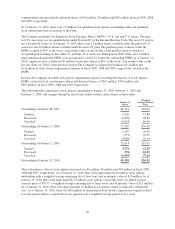
In total, the Company recorded stock-based compensation expense, including the expense of stock options,
ESPPs, restricted stock, performance shares and deferred shares, of $201 million, $176 million and
$207 million, in fiscal 2009, 2008 and 2007, respectively.
The following table summarizes stock options outstanding at January 31, 2010, February 1, 2009 and
February 3, 2008, and changes during the fiscal years ended on these dates (shares in thousands):
Number of
Shares
Weighted
Average Exercise
Price
Outstanding at January 28, 2007 66,141 $38.20
Granted 2,926 37.80
Exercised (6,859) 28.50
Canceled (9,843) 40.68
Outstanding at February 3, 2008 52,365 $38.98
Granted 5,226 26.09
Exercised (777) 22.55
Canceled (4,800) 39.14
Outstanding at February 1, 2009 52,014 $37.91
Granted 4,174 23.29
Exercised (374) 24.50
Canceled (6,505) 37.65
Outstanding at January 31, 2010 49,309 $36.81
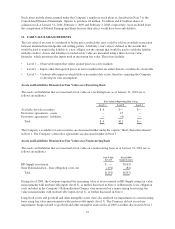
The total intrinsic value of stock options exercised was $1 million, $4 million and $63 million in fiscal 2009,
2008 and 2007, respectively. As of January 31, 2010, there were approximately 49 million stock options
outstanding with a weighted average remaining life of four years and an intrinsic value of $39 million. As of
January 31, 2010, there were approximately 39 million stock options exercisable with a weighted average
exercise price of $39.37, a weighted average remaining life of three years, and an intrinsic value of $11 million.
As of January 31, 2010, there were approximately 47 million stock options vested or expected to ultimately
vest. As of January 31, 2010, there was $42 million of unamortized stock-based compensation expense related
to stock options which is expected to be recognized over a weighted average period of two years.
49