Home Depot 2009 Annual Report Download - page 22
Download and view the complete annual report
Please find page 22 of the 2009 Home Depot annual report below. You can navigate through the pages in the report by either clicking on the pages listed below, or by using the keyword search tool below to find specific information within the annual report.-
 1
1 -
2
-
3
-
4
-
5
-
6
-
7
-
8
-
9
-
10
-
11
-
 12
12 -
 13
13 -
 14
14 -
 15
15 -
 16
16 -
 17
17 -
 18
18 -
 19
19 -
 20
20 -
 21
21 -
 22
22 -
 23
23 -
 24
24 -
 25
25 -
 26
26 -
 27
27 -
 28
28 -
 29
29 -
 30
30 -
 31
31 -
 32
32 -
33
-
34
-
35
-
36
-
37
-
38
-
39
-
40
-
41
-
42
-
43
-
44
-
45
-
46
-
47
-
48
-
49
-
50
-
51
-
52
-
53
-
54
-
55
-
56
-
57
-
58
-
59
-
60
-
61
-
62
-
63
-
64
-
65
-
66
-
67
-
68
-
69
-
70
-
71
-
72
 |
 |

Item 7. Management’s Discussion and Analysis of Financial Condition and Results of Operations.
Executive Summary and Selected Consolidated Statements of Earnings Data
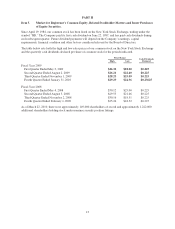
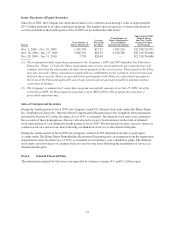
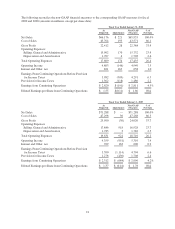
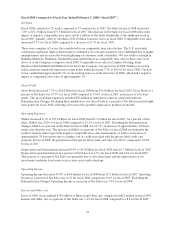
For fiscal year ended January 31, 2010 (“fiscal 2009”), we reported Net Earnings of $2.7 billion and Diluted
Earnings per Share of $1.57 compared to Net Earnings of $2.3 billion and Diluted Earnings per Share of $1.34
for fiscal year ended February 1, 2009 (“fiscal 2008”).
The results for fiscal 2009 and 2008 reflect the impact of several strategic actions initiated in fiscal 2008. These
strategic actions resulted in store rationalization charges related to the closing of 15 underperforming stores and
the removal of approximately 50 stores from our new store pipeline, business rationalization charges related to
the exit of our EXPO, THD Design Center, Yardbirds and HD Bath businesses (the “Exited Businesses”) and
charges related to the restructuring of support functions (collectively, the “Rationalization Charges”). These
actions resulted in pretax Rationalization Charges of $146 million and $951 million for fiscal 2009 and 2008,
respectively.
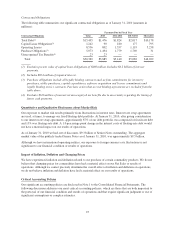
Our fiscal 2009 and 2008 results included a pretax charge of $163 million in each year to write-down our
investment in HD Supply, Inc. Additionally, fiscal 2009 included earnings of $41 million from discontinued
operations, net of tax, compared to a loss of $52 million from discontinued operations, net of tax, in fiscal 2008
for the settlement of working capital matters arising from the sale of HD Supply.
We reported Earnings from Continuing Operations of $2.6 billion and Diluted Earnings per Share from
Continuing Operations of $1.55 for fiscal 2009 compared to Earnings from Continuing Operations of
$2.3 billion and Diluted Earnings per Share from Continuing Operations of $1.37 for fiscal 2008. Excluding the
Rationalization Charges and the write-downs of our investment in HD Supply, Earnings from Continuing
Operations were $2.8 billion and Diluted Earnings per Share from Continuing Operations were $1.66 for fiscal
2009 compared to Earnings from Continuing Operations of $3.0 billion and Diluted Earnings per Share from
Continuing Operations of $1.78 for fiscal 2008.
Net Sales decreased 7.2% to $66.2 billion for fiscal 2009 from $71.3 billion for fiscal 2008. The slowdown in
the global economy and weakness in the U.S. residential construction, housing and home improvement markets
negatively impacted our Net Sales for fiscal 2009. Our comparable store sales declined 6.6% in fiscal 2009
driven by a 6.3% decline in our comparable store average ticket to $51.65, as well as a 0.3% decline in
comparable store customer transactions. Comparable store sales for our U.S. stores declined 6.2% in fiscal
2009.
In fiscal 2009, we continued to focus on our core retail business, investing in our associates and stores and
improving our customer service. The roll-out of our Customers FIRST training to all store associates and
support staff in the first quarter of fiscal 2009 has brought simplification and focus across the business, and we
are seeing the benefit of this in improved customer service ratings for fiscal 2009.
We also made significant progress on our merchandising tools in the U.S. that helped us to better manage
markdown and clearance activity and to better control inventory. At the end of fiscal 2009, our inventory had
decreased by $485 million, or 4.5%, from fiscal 2008. Additionally, our average inventory per store decreased
by 3.3% at the end of fiscal 2009 compared to last year. We continued our supply chain transformation to
improve product availability. At the end of fiscal 2009, we had 12 Rapid Deployment Centers (“RDCs”)
operating that serve approximately 65% of our U.S. stores. We remain committed to our overall RDC roll-out
strategy, supporting our goal of increasing our central distribution penetration. Our supply chain transformation
also includes restructuring our stocking distribution centers.
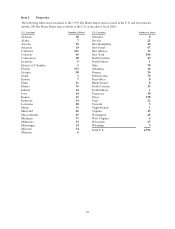
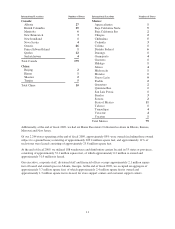
We opened 13 new stores in fiscal 2009, closed two stores in China and closed 41 stores related to our Exited
Businesses, bringing our total store count at the end of fiscal 2009 to 2,244. As of the end of fiscal 2009, a total
of 268 stores, or approximately 12%, were located in Canada, Mexico and China compared to 262 stores, or
approximately 12%, as of fiscal 2008.
16