Frontier Communications 2006 Annual Report Download - page 56
Download and view the complete annual report
Please find page 56 of the 2006 Frontier Communications annual report below. You can navigate through the pages in the report by either clicking on the pages listed below, or by using the keyword search tool below to find specific information within the annual report.-
 1
1 -
2
-
3
-
4
-
5
-
6
-
7
-
8
-
9
-
10
-
11
-
12
-
13
-
14
-
15
-
16
-
17
-
18
-
19
-
20
-
21
-
22
-
23
-
24
-
25
-
26
-
27
-
28
-
29
-
30
-
31
-
32
-
33
-
34
-
35
-
36
-
37
-
38
-
39
-
40
-
41
-
42
-
43
-
44
-
45
-
 46
46 -
 47
47 -
 48
48 -
 49
49 -
 50
50 -
 51
51 -
 52
52 -
 53
53 -
 54
54 -
 55
55 -
 56
56 -
 57
57 -
 58
58 -
 59
59 -
 60
60 -
 61
61 -
 62
62 -
 63
63 -
 64
64 -
 65
65 -
 66
66 -
67
-
68
-
69
-
70
-
71
-
72
-
73
-
74
-
75
-
76
-
77
-
78
-
79
-
80
-
81
-
82
-
83
-
84
-
85
-
86
-
87
-
88
-
89
-
90
-
91
-
92
-
93
-
94
-
95
-
96
-
97
-
98
 |
 |

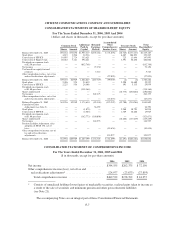
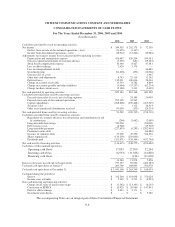
CITIZENS COMMUNICATIONS COMPANY AND SUBSIDIARIES
CONSOLIDATED STATEMENTS OF CASH FLOWS
For The Years Ended December 31, 2006, 2005 and 2004
($ in thousands)
2006 2005 2004
Cash flows provided by (used in) operating activities:
Net income ......................................................... $ 344,555 $ 202,375 $ 72,150
Deduct: Gain on sale of discontinued operations—(net) .................. (71,635) (1,167) —
Income from discontinued operations—(net) .......................... (18,912) (13,266) (15,086)
Adjustments to reconcile income to net cash provided by operating activities:
Depreciation and amortization expense ............................... 476,487 520,204 549,381
Gain on expiration/settlement of customer advance ..................... (3,539) (681) (25,345)
Stock based compensation expense .................................. 10,340 8,427 47,581
Loss on debt exchange ............................................ 2,420 3,175 —
Loss on extinguishment of debt ..................................... — — 66,480
Investment gains ................................................ (61,428) (492) (12,066)
Gain on sales of assets ............................................ — — 1,945
Other non-cash adjustments ........................................ 8,743 23,119 31,262
Deferred taxes .................................................. 132,031 100,636 24,016
Change in accounts receivable ...................................... 15,333 8,782 6,804
Change in accounts payable and other liabilities ........................ (3,064) (37,257) (62,234)
Change in other current assets ...................................... (2,148) 5,313 (3,639)
Net cash provided by operating activities ................................. 829,183 819,168 681,249
Cash flows provided from (used by) investing activities:
Proceeds from sales of assets, net of selling expenses .................... — 24,195 30,959
Proceeds from sale of discontinued operations ......................... 255,305 43,565 —
Capital expenditures .............................................. (268,806) (259,448) (263,949)
Securities sold .................................................. — 1,112 26,514
Other asset (purchased) distributions received ......................... 67,050 (139) (28,234)
Net cash provided from (used by) investing activities ........................ 53,549 (190,715) (234,710)
Cash flows provided from (used by) financing activities:
Repayment of customer advances for construction and contributions in aid
of construction ................................................ (264) (1,662) (2,089)
Long-term debt borrowings ........................................ 550,000 — 700,000
Debt issuance costs .............................................. (6,948) — (15,502)
Long-term debt payments ......................................... (227,693) (6,299) (1,202,403)
Premium to retire debt ............................................ — — (66,480)
Issuance of common stock ......................................... 27,200 47,550 544,562
Shares repurchased ............................................... (135,239) (250,000) —
Dividends paid .................................................. (323,671) (338,364) (832,768)
Net cash used by financing activities ..................................... (116,615) (548,775) (874,680)
Cash flows of discontinued operations:
Operating cash flows ...................................... 17,833 27,500 32,294
Investing cash flows ....................................... (6,593) (11,388) (14,820)
Financing cash flows ...................................... — (134) (11,618)
11,240 15,978 5,856
Increase (decrease) in cash and cash equivalents ........................... 777,357 95,656 (422,285)
Cash and cash equivalents at January 1, .................................. 263,749 168,093 590,378
Cash and cash equivalents at December 31, ............................... $ 1,041,106 $ 263,749 $ 168,093
Cash paid during the period for:
Interest ........................................................ $ 332,204 $ 318,638 $ 370,128
Income taxes (refunds) ............................................ $ 5,365 $ 4,711 $ (4,901)
Non-cash investing and financing activities:
Change in fair value of interest rate swaps ............................ $ (1,562) $ (13,193) $ (6,135)
Conversion of EPPICS ............................................ $ 15,925 $ 29,980 $ 147,991
Debt-for-debt exchange ........................................... $ 2,433 $ 2,171 $ —
Investment write-downs ........................................... $ — $ — $ 5,286
The accompanying Notes are an integral part of these Consolidated Financial Statements.
F-8