Frontier Communications 2006 Annual Report Download - page 38
Download and view the complete annual report
Please find page 38 of the 2006 Frontier Communications annual report below. You can navigate through the pages in the report by either clicking on the pages listed below, or by using the keyword search tool below to find specific information within the annual report.-
 1
1 -
2
-
3
-
4
-
5
-
6
-
7
-
8
-
9
-
10
-
11
-
12
-
13
-
14
-
15
-
16
-
17
-
18
-
19
-
20
-
21
-
22
-
23
-
24
-
25
-
26
-
27
-
 28
28 -
 29
29 -
 30
30 -
 31
31 -
 32
32 -
 33
33 -
 34
34 -
 35
35 -
 36
36 -
 37
37 -
 38
38 -
 39
39 -
 40
40 -
 41
41 -
 42
42 -
 43
43 -
 44
44 -
 45
45 -
 46
46 -
 47
47 -
 48
48 -
49
-
50
-
51
-
52
-
53
-
54
-
55
-
56
-
57
-
58
-
59
-
60
-
61
-
62
-
63
-
64
-
65
-
66
-
67
-
68
-
69
-
70
-
71
-
72
-
73
-
74
-
75
-
76
-
77
-
78
-
79
-
80
-
81
-
82
-
83
-
84
-
85
-
86
-
87
-
88
-
89
-
90
-
91
-
92
-
93
-
94
-
95
-
96
-
97
-
98
 |
 |

CITIZENS COMMUNICATIONS COMPANY AND SUBSIDIARIES
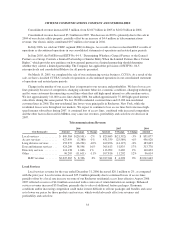
DEPRECIATION AND AMORTIZATION EXPENSE
($ in thousands) 2006 2005 2004
Amount $ Change % Change Amount $ Change % Change Amount
Depreciation expense ........ $350,107 $(43,719) -11% $393,826 $(29,035) -7% $422,861
Amortization expense ........ 126,380 2 0% 126,378 (142) 0% 126,520
$476,487 $(43,717) -8% $520,204 $(29,177) -5% $549,381
Depreciation expense for the years ended December 31, 2006 and 2005 decreased $43.7 million, or 11%,
and $29.0 million, or 7%, respectively, as compared with the prior years due to a declining net asset base and
changes in the remaining useful lives of certain assets. Effective with the completion of an independent study of
the estimated useful lives of our plant assets we adopted new lives beginning October 1, 2005. The study
concluded that remaining life estimates should be increased for copper facilities and decreased for switching
assets (among other less minor changes). This study was updated as of September 30, 2006. Based on the study
and our planned capital expenditures, we expect that our depreciation expense will continue to decline in 2007 by
approximately 5% as compared to 2006.
MANAGEMENT SUCCESSION AND STRATEGIC ALTERNATIVES EXPENSES
On July 11, 2004, our Board of Directors announced that it completed its review of our financial and
strategic alternatives. In 2004, we expensed $90.6 million of costs related to management succession and our
exploration of financial and strategic alternatives. Included are $36.6 million of non-cash expenses for the
acceleration of stock benefits, cash expenses of $19.2 million for advisory fees, $19.3 million for severance and
retention arrangements and $15.5 million primarily for tax reimbursements.
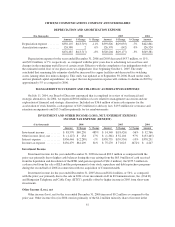
INVESTMENT AND OTHER INCOME (LOSS), NET / INTEREST EXPENSE /
INCOME TAX EXPENSE (BENEFIT)
($ in thousands) 2006 2005 2004
Amount $ Change % Change Amount $ Change % Change Amount
Investment income ........... $ 83,570 $69,230 483% $ 14,340 $(18,426) -56% $ 32,766
Other income (loss), net ....... $ (1,127) $ 234 17% $ (1,361) $ 52,104 97% $ (53,465)
Interest expense ............. $336,446 $ (2,289) -1% $338,735 $(39,556) -10% $378,291
Income tax expense .......... $136,479 $61,209 81% $ 75,270 $ 71,023 1672% $ 4,247
Investment Income
Investment income for the year ended December 31, 2006 increased $69.2 million as compared with the
prior year primarily due to higher cash balances during the year arising from the $65.0 million of cash received
from the liquidation and dissolution of the RTB (and gain recognized of $61.4 million), the $255.3 million in
cash received from the sale of ELI and the postponement of our stock repurchase and debt repurchase programs
during the second half of 2006 in connection with our acquisition of Commonwealth.
Investment income for the year ended December 31, 2005 decreased $18.4 million, or 56%, as compared
with the prior year primarily due to the sale in 2004 of our investments in D & E Communications, Inc. (D & E)
and Hungarian Telephone and Cable Corp. (HTCC), partially offset by higher income in 2005 from short-term
investments.
Other Income (Loss), net
Other income (loss), net for the year ended December 31, 2006 increased $0.2 million as compared to the
prior year. Other income (loss) in 2006 consists primarily of the $4.2 million minority share of income in the
37