Frontier Communications 2006 Annual Report Download - page 37
Download and view the complete annual report
Please find page 37 of the 2006 Frontier Communications annual report below. You can navigate through the pages in the report by either clicking on the pages listed below, or by using the keyword search tool below to find specific information within the annual report.-
 1
1 -
2
-
3
-
4
-
5
-
6
-
7
-
8
-
9
-
10
-
11
-
12
-
13
-
14
-
15
-
16
-
17
-
18
-
19
-
20
-
21
-
22
-
23
-
24
-
25
-
26
-
 27
27 -
 28
28 -
 29
29 -
 30
30 -
 31
31 -
 32
32 -
 33
33 -
 34
34 -
 35
35 -
 36
36 -
 37
37 -
 38
38 -
 39
39 -
 40
40 -
 41
41 -
 42
42 -
 43
43 -
 44
44 -
 45
45 -
 46
46 -
 47
47 -
48
-
49
-
50
-
51
-
52
-
53
-
54
-
55
-
56
-
57
-
58
-
59
-
60
-
61
-
62
-
63
-
64
-
65
-
66
-
67
-
68
-
69
-
70
-
71
-
72
-
73
-
74
-
75
-
76
-
77
-
78
-
79
-
80
-
81
-
82
-
83
-
84
-
85
-
86
-
87
-
88
-
89
-
90
-
91
-
92
-
93
-
94
-
95
-
96
-
97
-
98
 |
 |

Electric energy and fuel oil purchased
We sold our Vermont electric division on April 1, 2004. Electric energy and fuel oil purchased for the year
ended December 31, 2004 was $5.5 million. We have sold all of our electric operations and as a result will have
no operating results in future periods for these businesses.
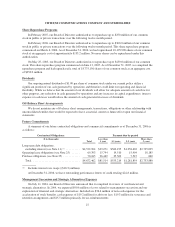
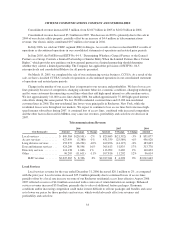
OTHER OPERATING EXPENSES
2006 2005 2004
($ in thousands) Amount $ Change % Change Amount $ Change % Change Amount
Operating expenses .......... $551,620 $(21,505) -4% $573,125 $(11,586) -2% $584,711
Taxes other than income
taxes ................... 86,568 (5,219) -6% 91,787 181 0% 91,606
Sales and marketing ......... 94,955 8,820 10% 86,135 1,302 2% 84,833
$733,143 $(17,904) -2% $751,047 $(10,103) -1% $761,150
Operating Expenses
Operating expenses for the year ended December 31, 2006 decreased $21.5 million, or 4%, as compared
with the prior year primarily due to headcount reductions and associated decreases in salaries and benefits and
improved expense control in benefit costs.
Operating expenses for the year ended December 31, 2005 decreased $11.6 million, or 2%, as compared
with the prior year primarily due to lower billing expenses as a result of the conversion of one of our billing
systems in 2004 partially offset by rate increases for federal USF mandated contributions and annual fees to
regulatory agencies.
We routinely review our operations, personnel and facilities to achieve greater efficiencies. We are in the
process of consolidating our call center operations. As we work through the consolidation, including the opening
of a new call center in Deland, FL in August 2006, and the closing of call centers in 2007, we expect that our
operating expenses will temporarily increase. As noted elsewhere, the introduction of new service offerings may
also negatively impact our cost structure.
Included in operating expenses is stock compensation expense. Stock compensation expense was $10.3
million and $8.4 million for the years ended December 31, 2006 and 2005, respectively. In 2006, we began
expensing the cost of the unvested portion of outstanding stock options pursuant to SFAS No. 123R.
Included in operating expenses is pension and other postretirement benefit expenses. Based on current
assumptions and plan asset values, we estimate that our pension and other postretirement benefit expenses which
was $11.3 million in 2006 will be approximately $11.0 million to $14.0 million in 2007 and that no contribution
will be required to be made by us to the pension plan in 2007. No contribution was made to our pension plan
during 2006. In future periods, if the value of our pension assets decline and/or projected benefit costs increase,
we may have increased pension expenses.
Taxes Other than Income Taxes
Taxes other than income taxes for the year ended December 31, 2006 decreased $5.2 million, or 6%, as
compared with the prior year primarily due to refunds received and changes in revenue subject to gross receipts
taxes.
Sales and Marketing
Sales and marketing expenses for the year ended December 31, 2006 increased $8.8 million, or 10%, as
compared with the prior year and increased $1.3 million, or 2% for the year ended 2005 as compared to 2004.
Sales and marketing expenses are increasing due to a competitive environment and the launch of new products.
As our markets become more competitive and we launch new products, we expect that our marketing costs may
increase.
36