Experian 2013 Annual Report Download - page 51
Download and view the complete annual report
Please find page 51 of the 2013 Experian annual report below. You can navigate through the pages in the report by either clicking on the pages listed below, or by using the keyword search tool below to find specific information within the annual report.-
 1
1 -
2
-
3
-
4
-
5
-
6
-
7
-
8
-
9
-
10
-
11
-
12
-
13
-
14
-
15
-
16
-
17
-
18
-
19
-
20
-
21
-
22
-
23
-
24
-
25
-
26
-
27
-
28
-
29
-
30
-
31
-
32
-
33
-
34
-
35
-
36
-
37
-
38
-
39
-
40
-
 41
41 -
 42
42 -
 43
43 -
 44
44 -
 45
45 -
 46
46 -
 47
47 -
 48
48 -
 49
49 -
 50
50 -
 51
51 -
 52
52 -
 53
53 -
 54
54 -
 55
55 -
 56
56 -
 57
57 -
 58
58 -
 59
59 -
 60
60 -
 61
61 -
62
-
63
-
64
-
65
-
66
-
67
-
68
-
69
-
70
-
71
-
72
-
73
-
74
-
75
-
76
-
77
-
78
-
79
-
80
-
81
-
82
-
83
-
84
-
85
-
86
-
87
-
88
-
89
-
90
-
91
-
92
-
93
-
94
-
95
-
96
-
97
-
98
-
99
-
100
-
101
-
102
-
103
-
104
-
105
-
106
-
107
-
108
-
109
-
110
-
111
-
112
-
113
-
114
-
115
-
116
-
117
-
118
-
119
-
120
-
121
-
122
-
123
-
124
-
125
-
126
-
127
-
128
-
129
-
130
-
131
-
132
-
133
-
134
-
135
-
136
-
137
-
138
-
139
-
140
-
141
-
142
-
143
-
144
-
145
-
146
-
147
-
148
-
149
-
150
-
151
-
152
-
153
-
154
-
155
-
156
-
157
-
158
-
159
-
160
-
161
-
162
-
163
-
164
-
165
-
166
-
167
-
168
-
169
-
170
-
171
-
172
-
173
-
174
-
175
-
176
 |
 |

Capital risk management
Our definition and management of capital
focuses on capital employed and the
Group’s capital employed is analysed in the
net assets summary table set out above.
Our objectives in managing capital are:
•To safeguard the ability to continue
as a going concern in order to provide
returns for shareholders and benefits
for other stakeholders; and
•To maintain an optimal capital
structure and cost of capital.
We remain committed to:
•A prudent but efficient balance sheet; and
•A target gearing ratio of 1.75 to 2.0
times EBITDA, consistent with a
desire to retain a strong investment-
grade credit rating.
To maintain or adjust the capital
structure, we may:
•Adjust the amount of dividends paid
to shareholders;
•Return capital to shareholders;
•Issue or purchase shares; or
•Sell assets to reduce net debt.
Going concern
The Board formed a judgment at the
time of approving the Group and the
parent company financial statements
that there was a reasonable expectation
that the Group and the Company had
adequate resources to continue in
operational existence for the foreseeable
future. In arriving at this conclusion the
Board took account of:
•Current and anticipated trading
performance which is the subject of
detailed comment elsewhere in the
business review;
•Current and anticipated levels of
borrowings and the availability of the
committed borrowing facilities which
are stated above; and
•Exposures to and management of
financial risks which are summarised
above and detailed in the notes to the
Group financial statements.
For this reason, the going concern
basis continues to be adopted in the
preparation of the Group and the parent
company financial statements.
Non-GAAP measures
Experian has identified certain measures
that it believes assist understanding of
the performance of the Group. As these
measures are not defined under IFRS
they may not be directly comparable with
other companies’ adjusted measures. The
non-GAAP measures are not intended to
be a substitute for, or superior to, any IFRS
measures of performance but management
has included them as they consider
them to be key measures used within the
business for assessing performance.
Discontinuing activities:
Experian defines discontinuing activities
as businesses sold, closed or identified
for closure during a financial year. These
are treated as discontinuing activities for
both revenue and EBIT purposes. The prior
period, where shown, is restated to disclose
separately the results of discontinuing
activities. This financial measure differs
from the definition of discontinued
operations set out in IFRS 5, which defines
a discontinued operation as a component
of an entity that has either been disposed
of, or is classified as held for sale, and
is: (i) a separate major line of business
or geographical area of operations; (ii)
part of a single plan to dispose of a major
line of business or geographical area of
operations; or (iii) a subsidiary acquired
exclusively with a view to resale.
Continuing activities:
Businesses trading at 31 March 2013 that
have not been disclosed as discontinuing
activities are treated as continuing activities.
Total growth:
This is the year-on-year change in the
performance of Experian’s activities.
Total growth at constant exchange
rates removes the translational foreign
exchange effects arising on the
consolidation of Experian’s activities.
Organic growth:
This is the year-on-year change in
the revenue of continuing activities,
at constant transactional and translation
exchange rates, excluding acquisitions
(other than affiliate credit bureaux) until
the first anniversary date of consolidation.
Constant exchange rates:
In order to illustrate its organic
performance, Experian discusses its
results in terms of constant exchange
rate growth, unless otherwise stated.
This represents growth calculated as if
the exchange rates used to determine
the results had remained unchanged
from those used in the previous year.
Other:
Further non-GAAP measures that are
included within the Group financial
statements are defined in note 7 to those
financial statements.
Roundings
Certain financial data have been
rounded within this report. As a result
of this rounding, the totals of data
presented may vary slightly from the
actual arithmetic totals of such data.
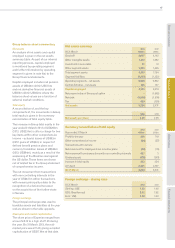
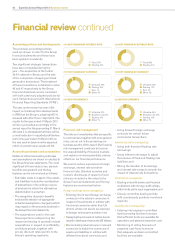
COMPARISON OF CAPITAL EXPENDITURE AND DEPRECIATION/AMORTISATION
2013 Capital expenditure (US$m)
2013 Depreciation/amortisation (US$m)
2012 Capital expenditure (US$m)
2012 Depreciation/amortisation (US$m)
Software Databases Property, plant and equipment Total
81
329
168
80
84 115
453 460
218 211
151 134
76
312
169
67
Business overview Business review Governance Financial statements
49