Experian 2013 Annual Report Download - page 45
Download and view the complete annual report
Please find page 45 of the 2013 Experian annual report below. You can navigate through the pages in the report by either clicking on the pages listed below, or by using the keyword search tool below to find specific information within the annual report.-
 1
1 -
2
-
3
-
4
-
5
-
6
-
7
-
8
-
9
-
10
-
11
-
12
-
13
-
14
-
15
-
16
-
17
-
18
-
19
-
20
-
21
-
22
-
23
-
24
-
25
-
26
-
27
-
28
-
29
-
30
-
31
-
32
-
33
-
34
-
 35
35 -
 36
36 -
 37
37 -
 38
38 -
 39
39 -
 40
40 -
 41
41 -
 42
42 -
 43
43 -
 44
44 -
 45
45 -
 46
46 -
 47
47 -
 48
48 -
 49
49 -
 50
50 -
 51
51 -
 52
52 -
 53
53 -
 54
54 -
 55
55 -
56
-
57
-
58
-
59
-
60
-
61
-
62
-
63
-
64
-
65
-
66
-
67
-
68
-
69
-
70
-
71
-
72
-
73
-
74
-
75
-
76
-
77
-
78
-
79
-
80
-
81
-
82
-
83
-
84
-
85
-
86
-
87
-
88
-
89
-
90
-
91
-
92
-
93
-
94
-
95
-
96
-
97
-
98
-
99
-
100
-
101
-
102
-
103
-
104
-
105
-
106
-
107
-
108
-
109
-
110
-
111
-
112
-
113
-
114
-
115
-
116
-
117
-
118
-
119
-
120
-
121
-
122
-
123
-
124
-
125
-
126
-
127
-
128
-
129
-
130
-
131
-
132
-
133
-
134
-
135
-
136
-
137
-
138
-
139
-
140
-
141
-
142
-
143
-
144
-
145
-
146
-
147
-
148
-
149
-
150
-
151
-
152
-
153
-
154
-
155
-
156
-
157
-
158
-
159
-
160
-
161
-
162
-
163
-
164
-
165
-
166
-
167
-
168
-
169
-
170
-
171
-
172
-
173
-
174
-
175
-
176
 |
 |

Social, ethical and
environmental performance
We made good progress in EMEA/
Asia Pacific this year. In EMEA our
community programme focused on
some big projects in Turkey, Monaco,
Italy, Spain and South Africa, with a
strong focus on financial empowerment.
We have singled out the projects
in Turkey and South Africa as case
studies in the Group’s 2013 Corporate
Responsibility Report and between the
two projects we reached 17,000 young
people and helped make them more
aware of money management and
risk issues.
Volunteering figures for EMEA/
Asia Pacific have increased 27% by
comparison with the prior year with a
huge uplift specifically in Asia Pacific.
Environmental performance was
focused on video conference facility
provision across EMEA and we saw an
associated reduction in travel. Individual
engagement of employees, especially
through the fun global ‘Green Challenge’
environmental programme, was high. We
saw 32 teams, with 242 employees across
16 countries, taking part and the winning
team came from EMEA, a fitting tribute
to the participation across the region.
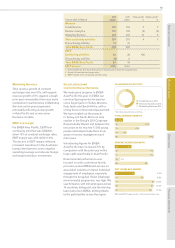
Marketing Services
Total revenue growth at constant
exchange rates was 10%, with organic
revenue growth of 6%. Against a tough
prior year comparable, there was some
moderation in performance in Marketing
Services as the year progressed,
principally reflecting slower growth
in Asia Pacific and across some
Eurozone markets.
EBIT and margin
For EMEA/Asia Pacific, EBIT from
continuing activities was US$26m,
down 18% at constant exchange rates.
EBIT margin was 4.5% (2012: 6.6%).
The decline in EBIT margin reflected
increased investment in the Australian
bureau development, some negative
operating leverage and adverse foreign
exchange translation movements.
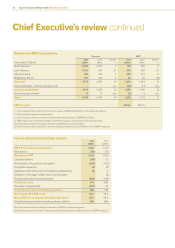
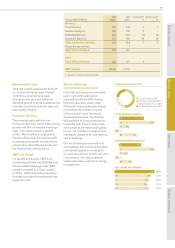
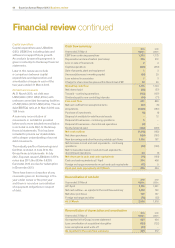
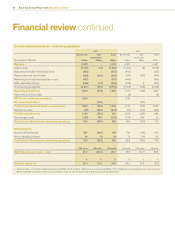
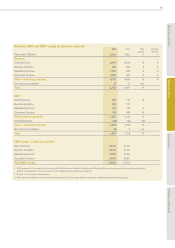
Year ended 31 March
2013
US$m
20121
US$m
Total growth2
%
Organic growth
2
%
Revenue
Credit Services 186 194 2 2
Decision Analytics 116 126 (4) (4)
Marketing Services 279 259 10 6
Total continuing activities 581 579 4 3
Discontinuing activities 17 30
Total EMEA/Asia Pacific 598 609
EBIT
Continuing activities 26 38 (18)
Discontinuing activities (2) 6
Total EMEA/Asia Pacific 24 44
EBIT margin34.5% 6.6%
1. 2012 restated for the movement of some businesses to discontinuing activities.
2. Growth at constant exchange rates.
3. EBIT margin is for continuing activities only.
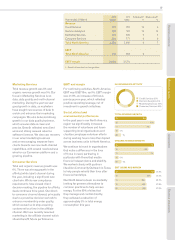
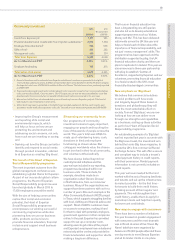
2013 REVENUE BY ACTIVITY 1
TOTAL REVENUE GROWTH
ORGANIC REVENUE GROWTH
EBIT (US$M) AND MARGIN
11.2%
10.4%
6.6%
11.5%
4.5%
10
11
12
09
13
10
11
12
09
13
10
11
12
09
13
6%
12%
17%
19%
4%
51
52
38
49
26
1%
7%
7%
6%
3%
EBIT and EBIT margin are for continuing activities only.
¹ Excludes discontinuing activities.
Credit Services 32%
Decision Analytics 20%
Marketing Services 48%
Business overview Business review Governance Financial statements
43