Experian 2013 Annual Report Download - page 140
Download and view the complete annual report
Please find page 140 of the 2013 Experian annual report below. You can navigate through the pages in the report by either clicking on the pages listed below, or by using the keyword search tool below to find specific information within the annual report.-
 1
1 -
2
-
3
-
4
-
5
-
6
-
7
-
8
-
9
-
10
-
11
-
12
-
13
-
14
-
15
-
16
-
17
-
18
-
19
-
20
-
21
-
22
-
23
-
24
-
25
-
26
-
27
-
28
-
29
-
30
-
31
-
32
-
33
-
34
-
35
-
36
-
37
-
38
-
39
-
40
-
41
-
42
-
43
-
44
-
45
-
46
-
47
-
48
-
49
-
50
-
51
-
52
-
53
-
54
-
55
-
56
-
57
-
58
-
59
-
60
-
61
-
62
-
63
-
64
-
65
-
66
-
67
-
68
-
69
-
70
-
71
-
72
-
73
-
74
-
75
-
76
-
77
-
78
-
79
-
80
-
81
-
82
-
83
-
84
-
85
-
86
-
87
-
88
-
89
-
90
-
91
-
92
-
93
-
94
-
95
-
96
-
97
-
98
-
99
-
100
-
101
-
102
-
103
-
104
-
105
-
106
-
107
-
108
-
109
-
110
-
111
-
112
-
113
-
114
-
115
-
116
-
117
-
118
-
119
-
120
-
121
-
122
-
123
-
124
-
125
-
126
-
127
-
128
-
129
-
 130
130 -
 131
131 -
 132
132 -
 133
133 -
 134
134 -
 135
135 -
 136
136 -
 137
137 -
 138
138 -
 139
139 -
 140
140 -
 141
141 -
 142
142 -
 143
143 -
 144
144 -
 145
145 -
 146
146 -
 147
147 -
 148
148 -
 149
149 -
 150
150 -
151
-
152
-
153
-
154
-
155
-
156
-
157
-
158
-
159
-
160
-
161
-
162
-
163
-
164
-
165
-
166
-
167
-
168
-
169
-
170
-
171
-
172
-
173
-
174
-
175
-
176
 |
 |

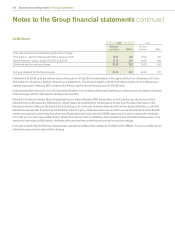
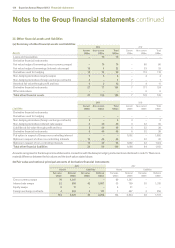
138 Experian Annual Report 2013 Financial statements
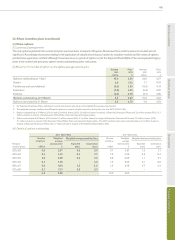
32. Other financial assets and liabilities
(a) Summary of other financial assets and liabilities
2013 2012
Assets
Current
US$m
Non-current
US$m
Total
US$m
Current
US$m
Non-current
US$m
Total
US$m
Loans and receivables – 79 79 – – –
Derivative financial instruments:
Fair value hedge of borrowings (cross currency swaps) – 70 70 – 80 80
Fair value hedge of borrowings (interest rate swaps) 18 4 22 – 33 33
Derivatives used for hedging 18 74 92 – 113 113
Non-hedging derivatives (equity swaps) 5 3 8 – 4 4
Non-hedging derivatives (foreign exchange contracts) 4 – 4 7 – 7
Assets at fair value through profit and loss 9 3 12 7 4 11
Derivative financial instruments 27 77 104 7 117 124
Other derivatives – – – – 6 6
Total other financial assets 27 156 183 7 123 130
2013 2012
Liabilities
Current
US$m
Non-current
US$m
Total
US$m
Current
US$m
Non-current
US$m
Total
US$m
Derivative financial instruments:
Derivatives used for hedging – – – – – –
Non-hedging derivatives (foreign exchange contracts) 3 – 3 3 – 3
Non-hedging derivatives (interest rate swaps) 2 40 42 3 32 35
Liabilities at fair value through profit and loss 5 40 45 6 32 38
Derivative financial instruments 5 40 45 6 32 38
Put option in respect of Serasa non-controlling interest – – –
1,092 – 1,092
Options in respect of other non-controlling interests 15 40 55 – 32 32
Options in respect of non-controlling interests 15 40 55 1,092 32 1,124
Total other financial liabilities 20 80 100 1,098 64 1,162
Amounts recognised in the Group income statement in connection with the Group’s hedging instruments are disclosed in note 15. There is no
material difference between the fair values and the book values stated above.
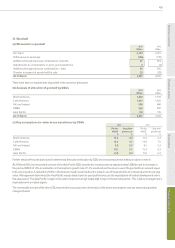
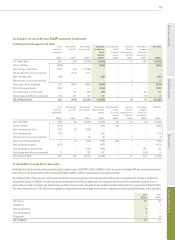
(b) Fair value and notional principal amounts of derivative financial instruments
2013 2012
Assets Liabilities Assets Liabilities
Fair value
US$m
Notional
US$m
Fair value
US$m
Notional
US$m
Fair value
US$m
Notional
US$m
Fair value
US$m
Notional
US$m
Cross currency swaps 70 1,347 – –
80 1,347 – –
Interest rate swaps 22 858 42 2,087 33 759 35 1,315
Equity swaps 8 17 – – 4 21 – –
Foreign exchange contracts 4 203 3 171 7 497 3 256
104 2,425 45 2,258 124 2,624 38 1,571
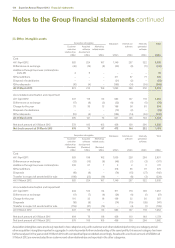
Notes to the Group financial statements continued