Experian 2013 Annual Report Download - page 129
Download and view the complete annual report
Please find page 129 of the 2013 Experian annual report below. You can navigate through the pages in the report by either clicking on the pages listed below, or by using the keyword search tool below to find specific information within the annual report.-
 1
1 -
2
-
3
-
4
-
5
-
6
-
7
-
8
-
9
-
10
-
11
-
12
-
13
-
14
-
15
-
16
-
17
-
18
-
19
-
20
-
21
-
22
-
23
-
24
-
25
-
26
-
27
-
28
-
29
-
30
-
31
-
32
-
33
-
34
-
35
-
36
-
37
-
38
-
39
-
40
-
41
-
42
-
43
-
44
-
45
-
46
-
47
-
48
-
49
-
50
-
51
-
52
-
53
-
54
-
55
-
56
-
57
-
58
-
59
-
60
-
61
-
62
-
63
-
64
-
65
-
66
-
67
-
68
-
69
-
70
-
71
-
72
-
73
-
74
-
75
-
76
-
77
-
78
-
79
-
80
-
81
-
82
-
83
-
84
-
85
-
86
-
87
-
88
-
89
-
90
-
91
-
92
-
93
-
94
-
95
-
96
-
97
-
98
-
99
-
100
-
101
-
102
-
103
-
104
-
105
-
106
-
107
-
108
-
109
-
110
-
111
-
112
-
113
-
114
-
115
-
116
-
117
-
118
-
 119
119 -
 120
120 -
 121
121 -
 122
122 -
 123
123 -
 124
124 -
 125
125 -
 126
126 -
 127
127 -
 128
128 -
 129
129 -
 130
130 -
 131
131 -
 132
132 -
 133
133 -
 134
134 -
 135
135 -
 136
136 -
 137
137 -
 138
138 -
 139
139 -
140
-
141
-
142
-
143
-
144
-
145
-
146
-
147
-
148
-
149
-
150
-
151
-
152
-
153
-
154
-
155
-
156
-
157
-
158
-
159
-
160
-
161
-
162
-
163
-
164
-
165
-
166
-
167
-
168
-
169
-
170
-
171
-
172
-
173
-
174
-
175
-
176
 |
 |

127
Business review Business overview Governance Financial statements
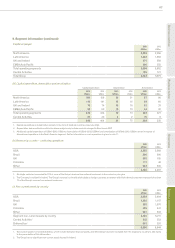
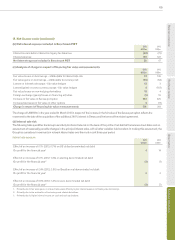
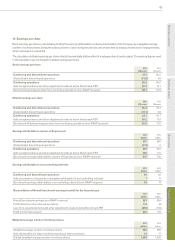
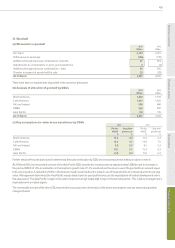
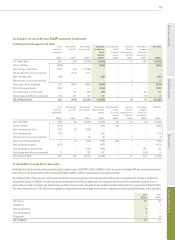
19. Earnings per share
Basic earnings per share is calculated by dividing the earnings attributable to ordinary shareholders of the Company by a weighted average
number of ordinary shares (being the ordinary shares in issue during the year less own shares held as treasury shares and in employee trusts,
which are treated as cancelled).
The calculation of diluted earnings per share reflects the potentially dilutive effect of employee share incentive plans. The earnings figures used
in the calculations are unchanged for diluted earnings per share.
Basic earnings per share
2013
US cents
2012
US cents
Continuing and discontinued operations 37.1 66.2
(Deduct)/add: discontinued operations (11.9) 0.6
Continuing operations 25.2 66.8
Add: exceptional items and other adjustments made to derive Benchmark PBT 60.5 12.1
Benchmark earnings per share from continuing operations (non-GAAP measure) 85.7 78.9
Diluted earnings per share
2013
US cents
2012
US cents
Continuing and discontinued operations 36.4 65.1
(Deduct)/add: discontinued operations (11.7) 0.6
Continuing operations 24.7 65.7
Add: exceptional items and other adjustments made to derive Benchmark PBT 59.2 11.8
Benchmark diluted earnings per share from continuing operations (non-GAAP measure) 83.9 77.5
Earnings attributable to owners of Experian plc
2013
US$m
2012
US$m
Continuing and discontinued operations 367 655
(Deduct)/add: discontinued operations (118) 6
Continuing operations 249 661
Add: exceptional items and other adjustments made to derive Benchmark PBT 598 119
Benchmark earnings attributable to owners of Experian plc (non-GAAP measure) 847 780
Earnings attributable to non-controlling interests
2013
US$m
2012
US$m
Continuing and discontinued operations 39 63
Add: amortisation of acquisition intangibles attributable to non-controlling interests 7 11
Benchmark earnings attributable to non-controlling interests (non-GAAP measure) 46 74
Reconciliation of Overall benchmark earnings to profit for the financial year
2013
US$m
2012
US$m
Overall benchmark earnings (non-GAAP measure) 893 854
Profit/(loss) from discontinued operations 118 (6)
Loss from exceptional items and other adjustments made to derive Benchmark PBT (605) (130)
Profit for the financial year 406 718
Weighted average number of ordinary shares
2013
million
2012
million
Weighted average number of ordinary shares 988 989
Add: dilutive effect of share incentive awards and share purchases 21 17
Diluted weighted average number of ordinary shares 1,009 1,006